| CATEGORY OF SCHEME | Value |
| INVESTMENT OBJECTIVE | The investment objective of the scheme is to seek to generate long term capital appreciation by investing substantially in a portfolio of equity and equity related instruments by following value investing strategy. However, there can be no assurance or guarantee that the investment objective of the scheme would be achieved. |
| Inception Date (Date of Allotment): | 14-June-2021 |
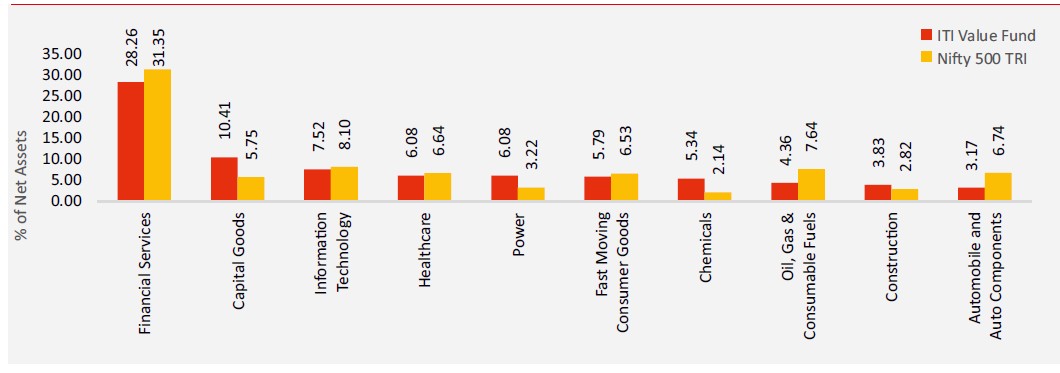
| Benchmark: | Nifty 500 TRI |
| Minimum Application Amount: | Rs.5,000/- and in multiples of Rs. 1/- thereafter |
| Load Structure: | Entry Load: Nil Exit Load: If redeemed/Switched out on or before 3 Months from the date of allotment; Exit Load is 0.50% Exit Load after completion of 3 months - NIL |
| Total Expense Ratio (TER): | Including Additional Expenses and Goods and Service
Tax on Management Fees |
| Fund Manager | Mr. Rohan Korde (Since 14-Jun-21) Total Experience: 17 years Mr. Dhimant Shah (Since 01-Dec-2022) Total Experience : 26 years |
| AUM (in Rs. Cr): | 330.61 |
| AAUM (in Rs. Cr): | 335.81 |
| % of top 5 holdings: | 19.65% |
| % of top 10 holdings: | 31.16% |
| No. of scrips: | 67 |
| Standard Deviation^: | 14.63% |
| Beta^: | 1.04 |
| Sharpe Ratio^*: | 1.01 |
| Average P/B | 6.39 |
| Average P/E | 26.23 |
| Portfolio Turnover Ratio | 1.29 |
| ^Computed for the 3-yr period ended ended July 31,
2025. Based on monthly return. * Risk free rate: 5.54 (Source: FIMMDA MIBOR) |
|
Regular Plan
(in Rs.) |
Direct Plan
(in Rs.) |
|
| Growth: | 16.4373 |
17.8697 |
| IDCW: | 16.4373 |
17.8697 |
Name of the Instrument |
% to
NAV |
% to NAV
Derivatives |
|
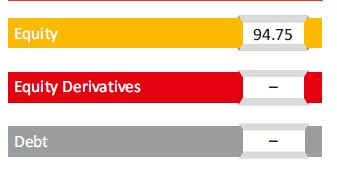
Equity & Equity Related Total |
94.75 |
||
Automobile and Auto Components |
3.17 |
||
Craftsman Automation Limited |
1.43 |
||
ZF Commercial Vehicle Control Systems India Limited |
1.08 |
||
Ather Energy Limited |
0.66 |
||
Capital Goods |
10.41 |
||
PTC Industries Limited |
1.36 |
||
Syrma SGS Technology Limited |
1.29 |
||
Ajax Engineering Limited |
1.12 |
||
Maharashtra Seamless Limited |
1.11 |
||
Finolex Industries Limited |
1.10 |
||
Bharat Heavy Electricals Limited |
0.98 |
||
JTL Industries Limited |
0.93 |
||
Finolex Cables Limited |
0.86 |
||
Bharat Bijlee Limited |
0.86 |
||
Mazagon Dock Shipbuilders Limited |
0.81 |
||
Chemicals |
5.34 |
||
Navin Fluorine International Limited |
1.82 |
||
Alkyl Amines Chemicals Limited |
1.60 |
||
Solar Industries India Limited |
0.99 |
||
UPL Limited |
0.93 |
||
Construction |
3.83 |
||
Larsen & Toubro Limited |
2.44 |
||
Engineers India Limited |
0.77 |
||
H.G. Infra Engineering Limited |
0.61 |
||
Construction Materials |
1.69 |
||
Ambuja Cements Limited |
1.69 |
||
Consumer Durables |
2.35 |
||
Blue Star Limited |
1.22 |
||
PG Electroplast Limited |
1.13 |
||
Consumer Services |
0.99 |
||
Thomas Cook (India) Limited |
0.99 |
||
Fast Moving Consumer Goods |
5.79 |
||
ITC Limited |
3.92 |
||
Hindustan Unilever Limited |
1.05 |
||
Mrs. Bectors Food Specialities Limited |
0.82 |
||
Financial Services |
28.26 |
||
HDFC Bank Limited |
5.45 |
||
Axis Bank Limited |
2.89 |
||
State Bank of India |
2.11 |
||
Shriram Finance Limited |
1.72 |
||
Bajaj Finserv Limited |
1.50 |
||
KFin Technologies Limited |
1.47 |
||
Kotak Mahindra Bank Limited |
1.44 |
||
Housing & Urban Development Corporation Limited |
1.32 |
||
LIC Housing Finance Limited |
1.21 |
||
Nippon Life India Asset Management Limited |
1.20 |
||
Motilal Oswal Financial Services Limited |
1.14 |
||
IDBI Bank Limited |
1.14 |
||
Aptus Value Housing Finance India Limited |
1.02 |
||
Equitas Small Finance Bank Limited |
1.01 |
||
PNB Housing Finance Limited |
0.95 |
||
Power Finance Corporation Limited |
0.93 |
||
DAM Capital Advisors Limited |
0.92 |
||
Karur Vysya Bank Limited |
0.86 |
||
Healthcare |
6.08 |
||
Wockhardt Limited |
1.92 |
||
Cohance Lifesciences Limited |
1.91 |
||
Aster DM Healthcare Limited |
1.53 |
||
Orchid Pharma Limited |
0.73 |
||
Information Technology |
7.52 |
||
Infosys Limited |
3.03 |
||
Affle 3i Limited |
1.93 |
||
Netweb Technologies India Limited |
1.12 |
||
Intellect Design Arena Limited |
1.00 |
||
Protean eGov Technologies Limited |
0.44 |
||
Metals & Mining |
1.63 |
||
Jindal Steel & Power Limited |
1.01 |
||
National Aluminium Company Limited |
0.63 |
||
Oil Gas & Consumable Fuels |
4.36 |
||
Reliance Industries Limited |
4.36 |
||
Power |
6.08 |
||
NTPC Limited |
2.51 |
||
NTPC Green Energy Limited |
1.71 |
||
CESC Limited |
1.04 |
||
Adani Energy Solutions Limited |
0.83 |
||
Realty |
2.59 |
||
Anant Raj Limited |
0.97 |
||
Sobha Limited |
0.95 |
||
Max Estates Limited |
0.67 |
||
Services |
0.96 |
||
Container Corporation of India Limited |
0.96 |
||
Telecommunication |
2.52 |
||
Bharti Airtel Limited |
2.52 |
||
Utilities |
1.16 |
||
VA Tech Wabag Limited |
1.16 |
||
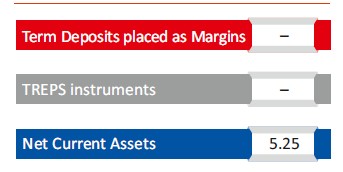
Short Term Debt & Net Current Assets |
5.25 |
Top Ten Holdings
Value of Investment of 10,000 |
||||||
| Period | Fund Returns (%) |
Benchmark Returns (%) |
Additional Benchmark Returns (%) |
Fund () |
Benchmark () |
Additional Benchmark () |
Regular - Growth |
||||||
| Last 1 Year | -8.88% |
-1.63% |
0.54% |
9,112 |
9,837 |
10,054 |
| Last 3 Years | 20.20% |
17.10% |
14.29% |
17,394 |
16,078 |
14,946 |
| Since Inception | 12.78% |
14.74% |
12.83% |
16,437 |
17,648 |
16,466 |
Direct - Growth |
||||||
| Last 1 Year | -7.20% |
-1.63% |
0.54% |
9,280 |
9,837 |
10,054 |
| Last 3 Years | 22.50% |
17.10% |
14.29% |
18,415 |
16,078 |
14,946 |
| Since Inception | 15.09% |
14.74% |
12.83% |
17,870 |
17,648 |
16,466 |
Past performance may or may not be sustained in future and is not a guarantee of any future returns, and should not be used as a basis of comparison with other investments. The performance data for 5 years period has not been provided, since scheme is in existence for less than 5 years. In case, the start / end date of the concerned period is a non-business date (NBD), the NAV of the previous date is considered for computation of returns. Different Plans i.e. Regular Plan and Direct Plan under the scheme have different expense structure. Benchmark: Nifty 500 TRI Additional Benchmark: Nifty 50 TRI. Fund Managers: Mr. Rohan Korde (Managing since 14-Jun-21) and Mr. Dhimant Shah (Managing since 01-December-2022). Inception date of the scheme (14-June-2021). Face Value per unit: Rs. 10. ITI Value Fund NAV as on July 31, 2025: Rs. 16.4373 (Regular Growth Option), Rs. 17.8697 (Direct Growth Option)
| Period | Amount Invested |
Fund Returns (%) |
Benchmark Returns (%) |
Additional Benchmark Returns (%) |
Fund Value () |
Benchmark Value () |
Additional Benchmark Value () |
Regular - Growth |
|||||||
| Last 1 Year | 1,20,000 |
1.00% |
5.07% |
5.66% |
1,20,642 |
1,23,239 |
1,23,612 |
| Last 3 Years | 3,60,000 |
15.46% |
15.66% |
13.10% |
4,52,610 |
4,53,899 |
4,37,497 |
| Since Inception | 5,00,000 |
15.47% |
15.20% |
12.85% |
6,88,677 |
6,84,880 |
6,53,037 |
Direct - Growth |
|||||||
| Last 1 Year | 1,20,000 |
2.80% |
5.07% |
5.66% |
1,21,790 |
1,23,239 |
1,23,612 |
| Last 3 Years | 3,60,000 |
17.71% |
15.66% |
13.10% |
4,67,278 |
4,53,899 |
4,37,497 |
| Since Inception | 5,00,000 |
17.75% |
15.20% |
12.85% |
7,20,822 |
6,84,880 |
6,53,037 |
Past performance may or may not be sustained in future and is not a guarantee of any future returns, and should not be used as a basis of comparison with other investments. Different Plans i.e. Regular Plan and Direct Plan under the scheme have different expense structure. Benchmark: Nifty 500 TRI Additional Benchmark: Nifty 50 TRI. For SIP returns, monthly investment of Rs.10,000 invested on the 1st business day of every month has been considered. CAGR Returns (%) are computed after accounting for the cash flow by using the XIRR method (investment internal rate of return).
Disclaimer - Fund SIP Performance
The performance details provided herein are of Growth option under Direct and Regular Plans. The Fund(s) offer Systematic Investment Plan (SIP) facility. To illustrate the advantages of SIP investments, this is how your investments would have grown if you had invested say Rs. 10,000 systematically on the first Business Day of every month over a period of time in the Growth Option of respective scheme. The returns are calculated by XIRR approach assuming investment of 10,000/- on the 1st working day of every month. XIRR helps in calculating return on investments given an initial and final value and a series of cash inflows and outflows with correct allowance for the time impact of the transactions.
THIS PRODUCT IS SUITABLE FOR INVESTORS WHO ARE SEEKING^
- Capital appreciation over long term
- Investments in portfolio predominantly consisting of equity and equity related instruments by following a value investment strategy.
^Investors should consult their financial advisers if in doubt about whether the product is suitable for them.


Face Value per Unit: Rs. 10 unless other wise specified; Data is as of July 31, 2025 unless other wise specified.
Mutual Fund investments are subject to market risks, read all scheme related documents carefully