| CATEGORY OF SCHEME | Large Cap Fund |
| INVESTMENT OBJECTIVE | The investment objective of the Scheme is to seek to generate long term capital appreciation by predominantly investing in equity and equity related securities of large cap stocks. However, there can be no assurance that the investment objective of the scheme would be achieved. |
| Inception Date (Date of Allotment): | 24-Dec-20 |
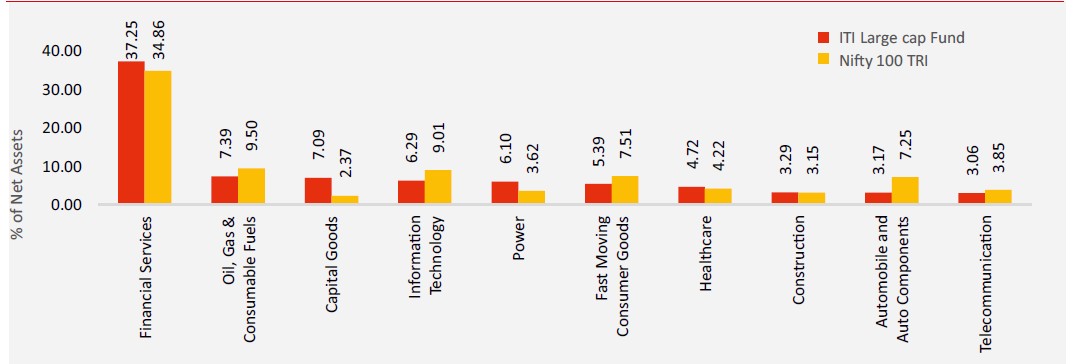
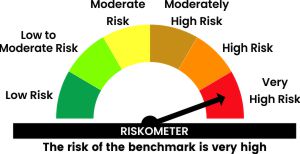
| Benchmark: | Nifty 100 TRI |
| Minimum Application Amount: | Rs. 5,000/- and in multiples of Re. 1/- thereafter |
| Load Structure: | Entry Load: Nil Exit Load: If redeemed/Switched out on or before 3 Months from the date of allotment; Exit Load is 0.50% Exit Load after completion of 3 months - NIL |
| Total Expense Ratio (TER): | Including Additional Expenses and Goods and Service
Tax on Management Fees |
| Fund Manager | Mr. Alok Ranjan (Since 04-Nov-2024) |
| AUM (in Rs. Cr): |
|
| AAUM (in Rs. Cr): | 547.61 |
| % of top 5 holdings: | 27.73% |
| % of top 10 holdings: | 41.65% |
| No. of scrips: | 66 |
| Standard Deviation^: | 13.48% |
| Beta^: | 1.00 |
| Sharpe Ratio^*: | 0.69 |
| Average P/B | 6.57 |
| Average P/E | 22.38 |
| Portfolio Turnover Ratio | 0.75 |
| ^Computed for the 3-yr period ended July 31, 2025.
Based on monthly return. * Risk free rate: 5.54 (Source: FIMMDA MIBOR) |
|
Regular Plan
(in Rs.) |
Direct Plan
(in Rs.) |
|
| Growth: | 17.4314 |
19.1565 |
| IDCW: | 17.4314 |
19.1565 |
Name of the Instrument |
% to
NAV |
% to NAV
Derivatives |
|
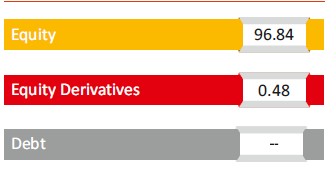
Equity & Equity Related Total |
96.84 |
0.48 |
|
Automobile and Auto Components |
3.17 |
||
Mahindra & Mahindra Limited |
1.74 |
||
Bajaj Auto Limited |
0.84 |
||
TVS Motor Company Limited |
0.59 |
||
Capital Goods |
7.09 |
||
Shakti Pumps (India) Limited |
1.49 |
||
Hindustan Aeronautics Limited |
1.22 |
||
Bharat Electronics Limited |
1.17 |
||
Standard Glass Lining Technology Ltd |
0.66 |
||
GE Vernova T&D India Limited |
0.63 |
||
Polycab India Limited |
0.60 |
||
Cummins India Limited |
0.59 |
||
Siemens Energy India Limited |
0.49 |
||
KSB Limited |
0.24 |
||
Construction |
3.29 |
||
Larsen & Toubro Limited |
2.73 |
||
Engineers India Limited |
0.56 |
||
Construction Materials |
2.32 |
||
UltraTech Cement Limited |
1.25 |
||
Ambuja Cements Limited |
1.07 |
||
Consumer Durables |
2.58 |
||
Titan Company Limited |
1.12 |
||
P N Gadgil Jewellers Limited |
0.84 |
||
Asian Paints Limited |
0.61 |
||
Consumer Services |
2.61 |
||
Avenue Supermarts Limited |
1.05 |
||
The Indian Hotels Company Limited |
0.58 |
||
Info Edge (India) Limited |
0.50 |
||
Trent Limited |
0.48 |
||
Fast Moving Consumer Goods |
5.39 |
||
ITC Limited |
2.26 |
||
Varun Beverages Limited |
1.89 |
||
Mrs. Bectors Food Specialities Limited |
0.71 |
||
Britannia Industries Limited |
0.53 |
||
Financial Services |
37.25 |
||
HDFC Bank Limited |
9.45 |
||
ICICI Bank Limited |
5.19 |
||
State Bank of India |
3.51 |
||
Axis Bank Limited |
2.83 |
||
Bajaj Finance Limited |
2.74 |
||
Kotak Mahindra Bank Limited |
2.55 |
||
PNB Housing Finance Limited |
1.60 |
||
Shriram Finance Limited |
1.38 |
||
Cholamandalam Investment and Finance Company Ltd |
1.32 |
||
KFin Technologies Limited |
1.30 |
||
Power Finance Corporation Limited |
1.29 |
||
SBI Life Insurance Company Limited |
1.10 |
||
Bajaj Finserv Limited |
1.02 |
||
REC Limited |
0.80 |
||
Jio Financial Services Limited |
0.58 |
||
Manappuram Finance Limited |
0.32 |
||
CSB Bank Limited |
0.25 |
||
Healthcare |
4.72 |
||
Wockhardt Limited |
1.65 |
||
Sun Pharmaceutical Industries Limited |
1.41 |
||
Apollo Hospitals Enterprise Limited |
0.95 |
||
Dr. Reddy's Laboratories Limited |
0.52 |
||
Divi's Laboratories Limited |
0.19 |
||
Information Technology |
6.29 |
||
Infosys Limited |
3.09 |
||
Tata Consultancy Services Limited |
2.34 |
||
Tech Mahindra Limited |
0.58 |
||
Zaggle Prepaid Ocean Services Limited |
0.28 |
||
Metals & Mining |
2.66 |
||
Hindalco Industries Limited |
1.19 |
||
JSW Steel Limited |
0.77 |
||
Vedanta Limited |
0.69 |
||
Oil Gas & Consumable Fuels |
7.39 |
||
Reliance Industries Limited |
6.50 |
||
Coal India Limited |
0.90 |
||
Power |
6.10 |
||
NTPC Limited |
2.14 |
||
JSW Energy Limited |
1.67 |
||
Tata Power Company Limited |
1.47 |
||
Power Grid Corporation of India Limited |
0.83 |
||
Realty |
0.64 |
0.48 |
|
DLF Limited |
0.64 |
0.48 |
|
Services |
2.28 |
||
InterGlobe Aviation Limited |
1.18 |
||
Sanghvi Movers Limited |
1.10 |
||
Telecommunication |
3.06 |
||
Bharti Airtel Limited |
3.06 |
||
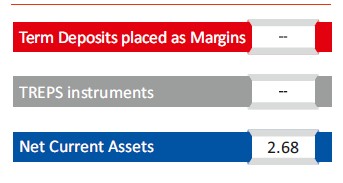
Short Term Debt & Net Current Assets |
2.68 |
Top Ten Holdings
| Period | Amount Invested |
Fund Returns (%) |
Benchmark Returns (%) |
Additional Benchmark Returns (%) |
Fund Value () |
Benchmark Value () |
Additional Benchmark Value () |
Regular - Growth |
|||||||
| Last 1 Year | 1,20,000 |
1.05% |
4.46% |
5.66% |
1,20,672 |
1,22,850 |
1,23,612 |
| Last 3 Years | 3,60,000 |
12.22% |
13.67% |
13.10% |
4,32,025 |
4,41,139 |
4,37,497 |
| Since Inception | 5,60,000 |
11.89% |
13.61% |
13.24% |
7,39,250 |
7,69,164 |
7,62,538 |
Direct - Growth |
|||||||
| Last 1 Year | 1,20,000 |
2.82% |
4.46% |
5.66% |
1,21,805 |
1,22,850 |
1,23,612 |
| Last 3 Years | 3,60,000 |
14.41% |
13.67% |
13.10% |
4,45,849 |
4,41,139 |
4,37,497 |
| Since Inception | 5,60,000 |
14.11% |
13.61% |
13.24% |
7,77,992 |
7,69,164 |
7,62,538 |
Past performance may or may not be sustained in future and is not a guarantee of any future returns, and should not be used as a basis of comparison with other investments. Different Plans i.e. Regular Plan and Direct Plan under the scheme have different expense structure. Benchmark: Nifty 100 TRI Additional Benchmark: Nifty 50 TRI. For SIP returns, monthly investment of Rs.10,000 invested on the 1st business day of every month has been considered. CAGR Returns (%) are computed after accounting for the cash flow by using the XIRR method (investment internal rate of return).
Disclaimer - Fund SIP Performance
The performance details provided herein are of Growth option under Direct and Regular Plans. The Fund(s) offer Systematic Investment Plan (SIP) facility. To illustrate the advantages of SIP investments, this is how your investments would have grown if you had invested say Rs. 10,000 systematically on the first Business Day of every month over a period of time in the Growth Option of respective scheme. The returns are calculated by XIRR approach assuming investment of 10,000/- on the 1st working day of every month. XIRR helps in calculating return on investments given an initial and final value and a series of cash inflows and outflows with correct allowance for the time impact of the transactions.
| Period | Fund Returns (%) |
Benchmark Returns (%) |
Additional Benchmark Returns (%) |
Fund (Rs) |
Benchmark (Rs) |
Additional Benchmark Returns (Rs) |
Regular - Growth |
||||||
| Last 1 Year | -6.12% |
-1.32% |
0.54% |
9,388 |
9,868 |
10,054 |
| Last 3 Years | 14.74% |
14.59% |
14.29% |
15,121 |
15,062 |
14,946 |
| Since Inception | 12.83% |
15.35% |
15.03% |
17,431 |
19,298 |
19,053 |
Direct - Growth |
||||||
| Last 1 Year | -4.42% |
-1.32% |
0.54% |
9,558 |
9,868 |
10,054 |
| Last 3 Years | 16.97% |
14.59% |
14.29% |
16,024 |
15,062 |
14,946 |
| Since Inception | 15.17% |
15.35% |
15.03% |
19,157 |
19,298 |
19,053 |
Past performance may or may not be sustained in future and is not a guarantee of any future returns, and should not be used as a basis of comparison with other investments. The performance data for 5 years period has not been provided, since scheme is in existence for less than 5 years. In case, the start / end date of the concerned period is a non-business date (NBD), the NAV of the previous date is considered for computation of returns. Different Plans i.e. Regular Plan and Direct Plan under the scheme have different expense structure. Benchmark: Nifty 100 TRI Additional Benchmark: Nifty 50 TRI. Fund Managers: Mr. Alok Ranjan (Managing Since 04-Nov-2024), Mr Rohan Korde (Managing Since 29-April-2022). Inception date of the scheme (24-Dec-20). Face Value per unit: Rs. 10. ITI Large Cap Fund NAV as on July 31, 2025: Rs. 17.4314 (Regular Growth Option), Rs. 19.1565 (Direct Growth Option)
THIS PRODUCT IS SUITABLE FOR INVESTORS WHO ARE SEEKING^
- Capital appreciation over long term
- Investment in equity and equity related instruments of large cap companies
^Investors should consult their financial advisers if in doubt about whether the product is suitable for them.

Face Value per Unit: Rs. 10 unless other wise specified; Data is as of July 31, 2025 unless other wise specified.
Mutual Fund investments are subject to market risks, read all scheme related documents carefully