| CATEGORY OF SCHEME | Mid Cap Fund |
| INVESTMENT OBJECTIVE | The investment objective of the Scheme is to seek to generate long term capital appreciation by predominantly investing in equity and equity related securities of Mid Cap stocks. However, there can be no assurance that the investment objective of the scheme would be achieved. |
| Inception Date (Date of Allotment): | 05-Mar-2021 |
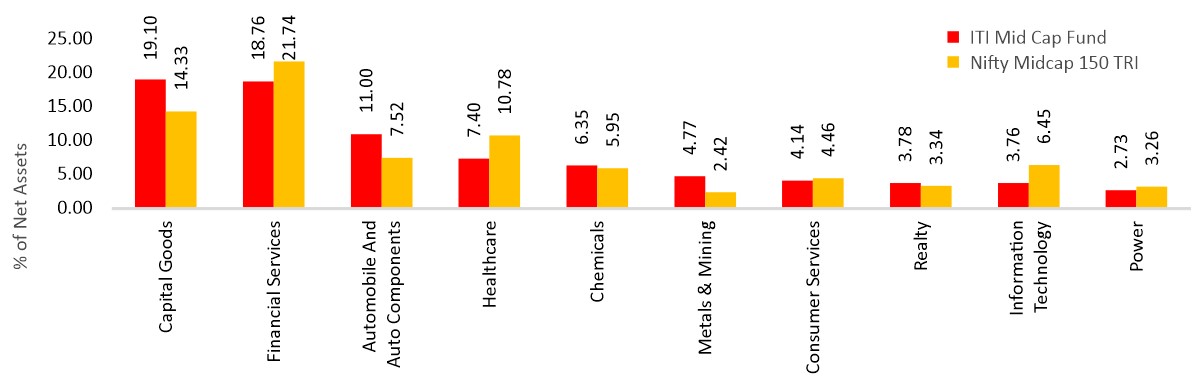
| Benchmark: | Nifty Midcap 150 TRI |
| Minimum Application Amount: | Rs.5,000/- and in multiples of Rs. 1/- thereafter |
| Load Structure: | Entry Load: Nil Exit Load: – If units are redeemed /switched out within 12 months - 1%. Nil thereafter |
| Total Expense Ratio (TER): | Including Additional Expenses and Goods and Service
Tax on Management Fees |
| Fund Manager | Mr. Rohan Korde (Since 29 April 2022) Total Experience: 19 years Mr. Dhimant Shah (Since 01-Oct-2022) Total Experience: 26 years |
| AUM (in Rs. Cr): | 532.06 |
| AAUM (in Rs. Cr): | 530.29 |
| % of top 5 holdings: | 13.36% |
| % of top 10 holdings: | 23.28% |
| No. of scrips: | 73 |
| Standard Deviation^: | NA |
| Beta^: | NA |
| Sharpe Ratio^*: | NA |
| Average P/B | 7.53 |
| Average P/E | 40.19 |
| Portfolio Beta | 0.93 |
| ^Scheme has not completed 3 years hence NA * Risk free rate: 6.95 (Source: FIMMDA MIBOR) | |
Regular Plan
(in Rs.) |
Direct Plan
(in Rs.) |
|
| Growth: | 14.0554 |
14.8723 |
| IDCW: | 14.0554 |
14.8723 |
Value of Investment of 10,000 |
||||||
| Period | Fund Returns (%) |
Benchmark Returns (%) |
Additional Benchmark Returns (%) |
Fund () |
Benchmark () |
Additional Benchmark () |
Regular - Growth |
||||||
| Last 1 Year | 21.5% |
30.8% |
16.1% |
12,147 |
13,067 |
11,606 |
| Since Inception | 14.2% |
23.0% |
12.6% |
14,055 |
17,010 |
13,572 |
Direct - Growth |
||||||
| Last 1 Year | 24.0% |
30.8% |
16.1% |
12,391 |
13,067 |
11,606 |
| Since Inception | 16.7% |
23.0% |
12.6% |
14,872 |
17,010 |
13,572 |
Past performance may or may not be sustained in future. Different Plans i.e. Regular Plan and Direct Plan under the scheme have different expense structure. Benchmark: Nifty Midcap 150 TRI Additional Benchmark: Nifty 50 TRI. Fund Managers: Mr. Rohan Korde (Managing since 29 April 2022) and Mr. Dhimant Shah (Managing since 01 October 2022). Inception date of the scheme (05-Mar-2021). Face Value per unit: Rs. 10.
| Period | Amount Invested |
Fund Value () |
Fund Returns (%) |
Benchmark Value () |
Benchmark Returns (%) |
Additional Benchmark Value () |
Additional Benchmark Returns (%) |
Regular - Growth |
|||||||
| Last 1 Year |
1,20,000 |
1,41,411 |
35.0% |
1,47,733 |
45.9% |
1,29,901 |
15.8% |
| Since Inception |
3,00,000 |
3,71,966 |
17.6% |
4,05,908 |
25.2% |
3,47,458 |
11.8% |
Direct - Growth |
|||||||
| Last 1 Year |
1,20,000 |
1,42,926 |
37.6% |
1,47,733 |
45.9% |
1,29,901 |
15.8% |
| Since Inception |
3,00,000 |
3,82,468 |
20.0% |
4,05,908 |
25.2% |
3,47,458 |
11.8% |
Past performance may or may not be sustained in future. Different Plans i.e. Regular Plan and Direct Plan under the scheme have different expense structure. Benchmark: Nifty Midcap 150 TRI Additional Benchmark: Nifty 50 TRI. For SIP returns, monthly investment of Rs.10,000 invested on the 1st business day of every month has been considered. CAGR Returns (%) are computed after accounting for the cash flow by using the XIRR method (investment internal rate of return).
Disclaimer - Fund SIP Performance
The performance details provided herein are of Growth option under Direct and Regular Plans. The Fund(s) offer Systematic Investment Plan (SIP) facility. To illustrate the advantages of SIP investments, this is how your investments would have grown if you had invested say Rs. 10,000 systematically on the first Business Day of every month over a period of time in the Growth Option of respective scheme. The returns are calculated by XIRR approach assuming investment of 10,000/- on the 1st working day of every month. XIRR helps in calculating return on investments given an initial and final value and a series of cash inflows and outflows with correct allowance for the time impact of the transactions.
Name of the Instrument |
% to
NAV |
% to NAV
Derivatives |
|
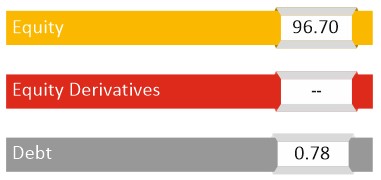
Equity & Equity Related Total |
96.70 |
||
Automobile and Auto Components |
11.00 |
||
TVS Motor Company Limited |
2.04 |
||
Schaeffler India Limited |
1.97 |
||
Motherson Sumi Wiring India Limited |
1.45 |
||
Bosch Limited |
1.34 |
||
Tube Investments of India Limited |
1.30 |
||
Sundram Fasteners Limited |
1.15 |
||
Sona BLW Precision Forgings Limited |
1.02 |
||
Samvardhana Motherson International Limited |
0.73 |
||
Capital Goods |
19.10 |
||
ABB India Limited |
1.92 |
||
Timken India Limited |
1.74 |
||
Suzlon Energy Limited |
1.71 |
||
Honeywell Automation India Limited |
1.64 |
||
Bharat Heavy Electricals Limited |
1.55 |
||
Bharat Dynamics Limited |
1.49 |
||
Bharat Electronics Limited |
1.44 |
||
Cummins India Limited |
1.35 |
||
Hindustan Aeronautics Limited |
1.29 |
||
Carborundum Universal Limited |
0.97 |
||
JTL Industries Limited |
0.86 |
||
Kaynes Technology India Limited |
0.84 |
||
SKF India Limited |
0.82 |
||
Ideaforge Technology Limited |
0.77 |
||
Inox Wind Limited |
0.69 |
||
Chemicals |
6.35 |
||
Solar Industries India Limited |
2.52 |
||
Vinati Organics Limited |
1.58 |
||
Sumitomo Chemical India Limited |
1.23 |
||
Gujarat Fluorochemicals Limited |
1.01 |
||
Construction |
0.97 |
||
Rail Vikas Nigam Limited |
0.97 |
||
Construction Materials |
1.77 |
||
Dalmia Bharat Limited |
1.02 |
||
JK Cement Limited |
0.74 |
||
Consumer Durables |
2.50 |
||
TTK Prestige Limited |
1.28 |
||
Crompton Greaves Consumer Electricals Limited |
1.22 |
||
Consumer Services |
4.14 |
||
Aditya Birla Fashion and Retail Limited |
1.91 |
||
Westlife Foodworld Limited |
1.19 |
||
Trent Limited |
1.03 |
||
Fast Moving Consumer Goods |
2.06 |
||
Emami Limited |
1.13 |
||
Patanjali Foods Limited |
0.94 |
||
Financial Services |
18.76 |
||
Union Bank of India |
3.10 |
||
Shriram Finance Limited |
2.87 |
||
The Federal Bank Limited |
2.74 |
||
Sundaram Finance Limited |
2.11 |
||
Max Financial Services Limited |
1.82 |
||
Power Finance Corporation Limited |
1.45 |
||
Ujjivan Financial Services Limited |
1.35 |
||
Mahindra & Mahindra Financial Services Limited |
1.17 |
||
Muthoot Finance Limited |
1.08 |
||
Indian Bank |
1.06 |
||
Healthcare |
7.40 |
||
Laurus Labs Limited |
2.09 |
||
Max Healthcare Institute Limited |
1.89 |
||
Aurobindo Pharma Limited |
1.26 |
||
Alkem Laboratories Limited |
1.16 |
||
Mankind Pharma Limited |
1.01 |
||
Information Technology |
3.76 |
||
Persistent Systems Limited |
1.76 |
||
Coforge Limited |
1.50 |
||
KPIT Technologies Limited |
0.50 |
||
Media, Entertainment & Publication |
1.38 |
||
Zee Entertainment Enterprises Limited |
1.38 |
||
Metals & Mining |
4.77 |
||
Jindal Stainless Limited |
1.54 |
||
Jindal Steel & Power Limited |
1.47 |
||
NMDC Limited |
1.04 |
||
Hindustan Copper Limited |
0.72 |
||
Oil Gas & Consumable Fuels |
0.89 |
||
Chennai Petroleum Corporation Limited |
0.89 |
||
Power |
2.73 |
||
NTPC Limited |
1.10 |
||
SJVN Limited |
0.98 |
||
NLC India Limited |
0.65 |
||
Realty |
3.78 |
||
The Phoenix Mills Limited |
1.38 |
||
Indiabulls Real Estate Limited |
1.00 |
||
Brigade Enterprises Limited |
0.83 |
||
Shriram Properties Limited |
0.57 |
||
Services |
1.52 |
||
Container Corporation of India Limited |
0.98 |
||
Blue Dart Express Limited |
0.54 |
||
Telecommunication |
1.58 |
||
Tata Communications Limited |
1.58 |
||
Textiles |
2.25 |
||
Page Industries Limited |
1.44 |
||
Ganesha Ecosphere Limited |
0.81 |
||
Mutual Fund Units |
0.78 |
||
ITI Banking & PSU Debt Fund -Direct Plan -Growth Option |
0.78 |
||
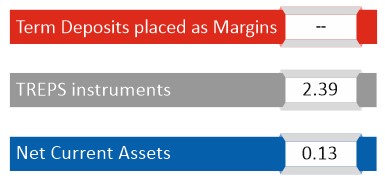
Short Term Debt & Net Current Assets |
2.52 |
Top Ten Holdings
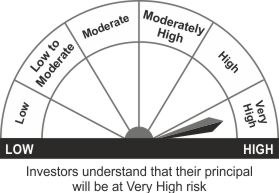
THIS PRODUCT IS SUITABLE FOR INVESTORS WHO ARE SEEKING^
- Capital appreciation over long term
- Investment in a diversified portfolio predominantly consisting of equity and equity related instruments of mid cap companies
^Investors should consult their financial advisers if in doubt about whether the product is suitable for them.
Face Value per Unit: Rs. 10 unless other wise specified; Data is as of September 30, 2023 unless other wise specified.
Mutual Fund investments are subject to market risks, read all scheme related documents carefully