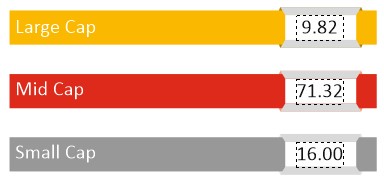
| CATEGORY OF SCHEME | Mid Cap Fund |
| INVESTMENT OBJECTIVE | The investment objective of the Scheme is to seek to generate long term capital appreciation by predominantly investing in equity and equity related securities of Mid Cap stocks. However, there can be no assurance that the investment objective of the scheme would be achieved. |
| Inception Date (Date of Allotment): | 05-Mar-2021 |
| Benchmark: | Nifty Midcap 150 TRI |
| Minimum Application Amount: | Rs.5,000/- and in multiples of Rs. 1/- thereafter |
| Load Structure: | Entry Load: Nil Exit Load: – If units are redeemed /switched out within 12 months - 1%. Nil thereafter |
| Total Expense Ratio (TER): | Including Additional Expenses and Goods and Service
Tax on Management Fees |
| Fund Manager | Mr. Rohan Korde (Since 29 April 2022) Total Experience: 19 years Mr. Dhimant Shah (Since 01-Oct-2022) Total Experience: 26 years |
| AUM (in Rs. Cr): | 1105.43 |
| AAUM (in Rs. Cr): | 1123.67 |
| % of top 5 holdings: | 12.03% |
| % of top 10 holdings: | 21.49% |
| No. of scrips: | 79 |
| Standard Deviation^: | 15.24% |
| Beta^: | 0.91 |
| Sharpe Ratio^*: | 1.13 |
| Average P/B | 10.01 |
| Average P/E | 35.61 |
| Portfolio Turnover Ratio | 1.36 |
^Computed for the 3-yr period ended October 31, 2024. Based on monthly return. * Risk free rate: 6.61 (Source: FIMMDA MIBOR) |
|
Regular Plan
(in Rs.) |
Direct Plan
(in Rs.) |
|
| Growth: | 21.1666 |
22.8314 |
| IDCW: | 20.2250 |
21.8788 |
Value of Investment of 10,000 |
||||||
| Period | Fund Returns (%) |
Benchmark Returns (%) |
Additional Benchmark Returns (%) |
Fund () |
Benchmark () |
Additional Benchmark () |
Regular - Growth |
||||||
| Last 1 Year | 54.98% |
44.01% |
28.30% |
15,517 |
14,415 |
12,839 |
| Last 3 Years | 20.68% |
23.21% |
12.35% |
17,601 |
18,734 |
14,195 |
| Since Inception | 22.74% |
26.43% |
15.50% |
21,167 |
23,592 |
16,947 |
Direct - Growth |
||||||
| Last 1 Year | 57.72% |
44.01% |
28.30% |
15,792 |
14,415 |
12,839 |
| Last 3 Years | 23.13% |
23.21% |
12.35% |
18,699 |
18,734 |
14,195 |
| Since Inception | 25.30% |
26.43% |
15.50% |
22,831 |
23,592 |
16,947 |
Past performance may or may not be sustained in future and is not a guarantee of any future returns, and should not be used as a basis of comparison with other investments. The performance data for 5 years period has not been provided, since scheme is in existence for less than 5 years. In case, the start / end date of the concerned period is a non-business date (NBD), the NAV of the previous date is considered for computation of returns. Different Plans i.e. Regular Plan and Direct Plan under the scheme have different expense structure. Benchmark: Nifty Midcap 150 TRI Additional Benchmark: Nifty 50 TRI. Fund Managers: Mr. Rohan Korde (Managing since 29-April-2022) and Mr. Dhimant Shah (Managing since 01-October-2022). Inception date of the scheme (05-Mar-2021). Face Value per unit: Rs. 10.
ITI Mid Cap Fund NAV as on October 31, 2024: Rs. 21.1666 (Regular Growth Option), Rs. 22.8314 (Direct Growth Option)
| Period | Amount Invested |
Fund Value () |
Fund Returns (%) |
Benchmark Value () |
Benchmark Returns (%) |
Additional Benchmark Value () |
Additional Benchmark Returns (%) |
Regular - Growth |
|||||||
| Last 1 Year |
1,20,000 |
1,36,619 |
26.58% |
1,34,607 |
23.27% |
1,29,344 |
14.72% |
| Last 3 Years |
3,60,000 |
5,76,399 |
33.06% |
5,62,670 |
31.24% |
4,64,325 |
17.23% |
| Since Inception |
4,40,000 |
7,32,929 |
28.81% |
7,35,010 |
28.98% |
5,92,705 |
16.42% |
Direct - Growth |
|||||||
| Last 1 Year |
1,20,000 |
1,38,015 |
28.90% |
1,34,607 |
23.27% |
1,29,344 |
14.72% |
| Last 3 Years |
3,60,000 |
5,95,508 |
35.55% |
5,62,670 |
31.24% |
4,64,325 |
17.23% |
| Since Inception |
4,40,000 |
7,63,269 |
31.24% |
7,35,010 |
28.98% |
5,92,705 |
16.42% |
Past performance may or may not be sustained in future and is not a guarantee of any future returns, and should not be used as a basis of comparison with other investments. Different Plans i.e. Regular Plan and Direct Plan under the scheme have different expense structure. Benchmark: Nifty Midcap 150 TRI Additional Benchmark: Nifty 50 TRI. For SIP returns, monthly investment of Rs.10,000 invested on the 1st business day of every month has been considered. CAGR Returns (%) are computed after accounting for the cash flow by using the XIRR method (investment internal rate of return).
Disclaimer - Fund SIP Performance
The performance details provided herein are of Growth option under Direct and Regular Plans. The Fund(s) offer Systematic Investment Plan (SIP) facility. To illustrate the advantages of SIP investments, this is how your investments would have grown if you had invested say Rs. 10,000 systematically on the first Business Day of every month over a period of time in the Growth Option of respective scheme. The returns are calculated by XIRR approach assuming investment of 10,000/- on the 1st working day of every month. XIRR helps in calculating return on investments given an initial and final value and a series of cash inflows and outflows with correct allowance for the time impact of the transactions.
Name of the Instrument |
% to
NAV |
% to NAV
Derivatives |
|
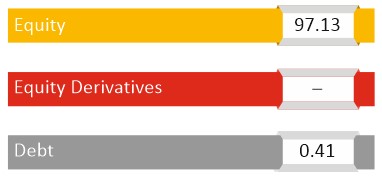
Equity & Equity Related Total |
97.13 |
||
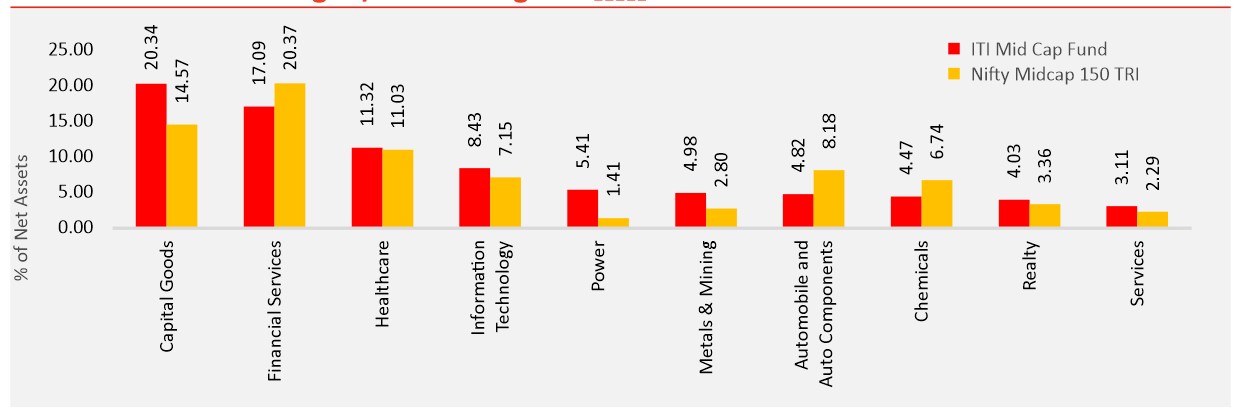
Automobile and Auto Components |
4.82 |
||
Tube Investments of India Limited |
1.64 |
||
TVS Motor Company Limited |
1.14 |
||
Schaeffler India Limited |
1.12 |
||
ZF Commercial Vehicle Control Systems India Limited |
0.92 |
||
Capital Goods |
20.34 |
||
Suzlon Energy Limited |
2.20 |
||
Bharat Heavy Electricals Limited |
1.59 |
||
Cummins India Limited |
1.43 |
||
GE T&D India Limited |
1.22 |
||
Bharat Dynamics Limited |
1.18 |
||
Inox Wind Limited |
1.12 |
||
Premier Energies Limited |
1.09 |
||
Usha Martin Limited |
1.04 |
||
Escorts Kubota Limited |
1.01 |
||
PTC Industries Limited |
1.00 |
||
Timken India Limited |
0.97 |
||
Astral Limited |
0.94 |
||
Honeywell Automation India Limited |
0.92 |
||
AIA Engineering Limited |
0.91 |
||
Jyoti CNC Automation Ltd |
0.90 |
||
Cochin Shipyard Limited |
0.87 |
||
Jupiter Wagons Limited |
0.74 |
||
Kirloskar Oil Engines Limited |
0.73 |
||
Man Industries (India) Limited |
0.47 |
||
Chemicals |
4.47 |
||
Solar Industries India Limited |
2.45 |
||
PI Industries Limited |
1.20 |
||
Navin Fluorine International Limited |
0.81 |
||
Construction |
1.94 |
||
H.G. Infra Engineering Limited |
0.88 |
||
Sterling And Wilson Renewable Energy Limited |
0.84 |
||
Afcons Infrastructure Limited |
0.23 |
||
Construction Materials |
1.00 |
||
JK Cement Limited |
1.00 |
||
Consumer Durables |
2.94 |
||
Dixon Technologies (India) Limited |
1.16 |
||
Voltas Limited |
1.01 |
||
Senco Gold Limited |
0.77 |
||
Consumer Services |
2.11 |
||
Zomato Limited |
1.18 |
||
Aditya Birla Fashion and Retail Limited |
0.94 |
||
Fast Moving Consumer Goods |
1.65 |
||
Marico Limited |
1.65 |
||
Financial Services |
17.09 |
||
Indian Bank |
1.78 |
||
Sundaram Finance Limited |
1.49 |
||
Max Financial Services Limited |
1.46 |
||
REC Limited |
1.40 |
||
The Federal Bank Limited |
1.35 |
||
PB Fintech Limited |
1.29 |
||
AU Small Finance Bank Limited |
1.25 |
||
Muthoot Finance Limited |
1.25 |
||
Mahindra & Mahindra Financial Services Limited |
1.10 |
||
L&T Finance Limited |
1.05 |
||
Nippon Life India Asset Management Limited |
1.01 |
||
Power Finance Corporation Limited |
0.96 |
||
IIFL Finance Limited |
0.90 |
||
Central Depository Services (India) Limited |
0.82 |
||
Healthcare |
11.32 |
||
Lupin Limited |
3.11 |
||
Aurobindo Pharma Limited |
1.81 |
||
Syngene International Limited |
1.74 |
||
Fortis Healthcare Limited |
1.52 |
||
Max Healthcare Institute Limited |
1.15 |
||
Biocon Limited |
1.00 |
||
GlaxoSmithKline Pharmaceuticals Limited |
0.98 |
||
Information Technology |
8.43 |
||
Mphasis Limited |
2.21 |
||
Persistent Systems Limited |
1.94 |
||
Oracle Financial Services Software Limited |
1.75 |
||
L&T Technology Services Limited |
1.52 |
||
KPIT Technologies Limited |
1.01 |
||
Metals & Mining |
4.98 |
||
National Aluminium Company Limited |
2.02 |
||
Jindal Steel & Power Limited |
1.07 |
||
NMDC Limited |
0.97 |
||
Jindal Stainless Limited |
0.93 |
||
Oil Gas & Consumable Fuels |
1.09 |
||
Hindustan Petroleum Corporation Limited |
1.09 |
||
Power |
5.41 |
||
SJVN Limited |
1.91 |
||
NTPC Limited |
1.40 |
||
Tata Power Company Limited |
1.09 |
||
Torrent Power Limited |
1.00 |
||
Realty |
4.03 |
||
The Phoenix Mills Limited |
2.05 |
||
Prestige Estates Projects Limited |
1.29 |
||
Brigade Enterprises Limited |
0.69 |
||
Services |
3.11 |
||
Container Corporation of India Limited |
1.28 |
||
Firstsource Solutions Limited |
0.92 |
||
JSW Infrastructure Ltd |
0.91 |
||
Telecommunication |
1.35 |
||
Bharti Hexacom Limited |
1.35 |
||
Textiles |
1.05 |
||
Page Industries Limited |
1.05 |
||
Mutual Fund Units |
0.41 |
||
ITI Banking & PSU Debt Fund -Direct Plan -Growth Option |
0.41 |
||
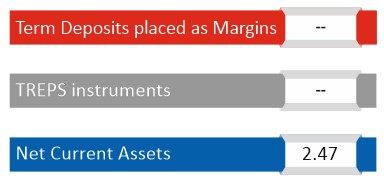
Short Term Debt & Net Current Assets |
2.47 |
Top Ten Holdings
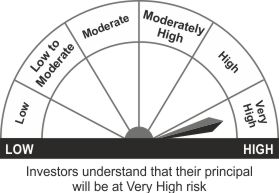
THIS PRODUCT IS SUITABLE FOR INVESTORS WHO ARE SEEKING^
- Capital appreciation over long term
- Investment in a diversified portfolio predominantly consisting of equity and equity related instruments of mid cap companies
^Investors should consult their financial advisers if in doubt about whether the product is suitable for them.
Face Value per Unit: Rs. 10 unless other wise specified; Data is as of October 31, 2024 unless other wise specified.
Mutual Fund investments are subject to market risks, read all scheme related documents carefully