| CATEGORY OF SCHEME | Balanced Advantage |
| INVESTMENT OBJECTIVE | The investment objective of the Scheme is to seek capital appreciation by investing in equity and equity related securities and fixed income instruments. The allocation between equity instruments and fixed income will be managed dynamically so as to provide investors with long term capital appreciation. However, there can be no assurance that the investment objective of the scheme will be realized. |
| Inception Date (Date of Allotment): | 31-Dec-19 |
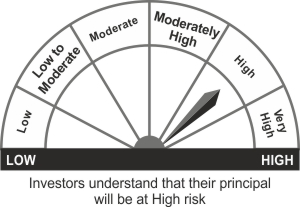
| Benchmark: | Nifty 50 Hybrid Composite Debt 50:50 Index |
| Minimum Application Amount: | Rs.5,000/- and in multiples of Rs. 1/- thereafter |
| Load Structure: | Entry Load: Nil Exit Load: 10% of the units allotted may be redeemed without any exit load, on or before completion of 3 months from the date of allotment of units. Any redemption in excess of such limit in the first 3 months from the date of allotment shall be subject to the following exit load i. 1% if redeemed or switched out on or before completion of 3 months from the date of allotment of units ii. Nil, if redeemed or switched out after completion of 3 months from the date of allotment of units. |
| Total Expense Ratio (TER):* | Including Additional Expenses and Goods and Service
Tax on Management Fees Regular Plan: 2.35% Direct Plan: 0.55% |
| Fund Manager | Mr. Dhimant Shah (Since 08-Aug-22) Total Experience: 26 years Mr. Rohan Korde (Since 01-Dec-22) Total Experience: 19 years Mr. Vikrant Mehta (Since 10-Feb-22) Total experience: 28 years |
| AUM (in Rs. Cr): | 375.04 |
| AAUM (in Rs. Cr): | 388.87 |
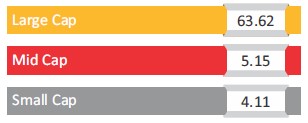
| % of top 5 holdings: | 28.16% |
| % of top 10 holdings: | 45.46% |
| No. of scrips: | 45 |
| Average Maturity: | 0.21 Year |
| Macaulay Duration: | 0.20 Year |
| Modified Duration: | 0.19 Year |
| Yield to Maturity: | 7.01% |
| Standard Deviation^: | 7.80% |
| Beta^: | 0.76 |
| Sharpe Ratio^*: | 0.44 |
| Average P/B | 4.25 |
| Average P/E | 23.50 |
| ^Computed for the 3-yr period ended June 30, 2023. Based on daily NAV. * Risk free rate: 6.90(Source: FIMMDA MIBOR) | |
Regular Plan
(in Rs.) |
Direct Plan
(in Rs.) |
|
| Growth: | 11.2262 |
12.0859 |
| IDCW: | 11.2262 |
12.0859 |
Name of the Instrument |
% to
NAV |
% to NAV
Derivatives |
|
Equity & Equity Related Total |
72.88 |
-6.13 |
|
Automobile and Auto Components |
8.79 |
-2.31 |
|
Maruti Suzuki India Limited |
3.27 |
-2.71 |
|
TVS Motor Company Limited |
1.59 |
||
Schaeffler India Limited |
1.26 |
||
CIE Automotive India Limited |
1.09 |
||
Tata Motors Limited |
0.80 |
-0.80 |
|
Bajaj Auto Limited |
0.77 |
||
MRF Limited |
1.19 |
||
Chemicals |
0.79 |
1.10 |
|
PCBL Limited |
0.79 |
||
Coromandel International Limited |
1.10 |
||
Construction |
3.00 |
||
Larsen & Toubro Limited |
3.00 |
||
Construction Materials |
1.05 |
-0.33 |
|
UltraTech Cement Limited |
0.72 |
||
Ambuja Cements Limited |
0.33 |
-0.33 |
|
Consumer Durables |
2.27 |
||
Titan Company Limited |
2.27 |
||
Fast Moving Consumer Goods |
6.95 |
1.11 |
|
ITC Limited |
4.30 |
||
Hindustan Unilever Limited |
1.82 |
||
Britannia Industries Limited |
0.45 |
||
Tata Consumer Products Limited |
0.39 |
||
Marico Limited |
1.11 |
||
Financial Services |
25.52 |
-2.26 |
|
HDFC Bank Limited |
6.17 |
||
Housing Development Finance Corporation Limited |
3.83 |
||
ICICI Bank Limited |
3.24 |
-1.04 |
|
Axis Bank Limited |
2.32 |
||
PB Fintech Limited |
1.67 |
||
SBI Life Insurance Company Limited |
1.44 |
||
ICICI Securities Limited |
1.22 |
||
HDFC Life Insurance Company Limited |
1.08 |
1.03 |
|
Ujjivan Financial Services Limited |
1.00 |
||
Bajaj Finance Limited |
1.00 |
-0.70 |
|
Bajaj Finserv Limited |
0.69 |
-0.31 |
|
Bank of Baroda |
0.53 |
-0.54 |
|
State Bank of India |
0.51 |
||
Canara Bank |
0.46 |
-0.46 |
|
Kotak Mahindra Bank Limited |
0.34 |
-0.26 |
|
Healthcare |
3.91 |
3.15 |
|
Mankind Pharma Limited |
2.08 |
||
Sun Pharmaceutical Industries Limited |
0.87 |
||
Cipla Limited |
0.39 |
||
Apollo Hospitals Enterprise Limited |
0.39 |
||
Zydus Lifesciences Limited |
0.17 |
-0.17 |
|
Metropolis Healthcare Limited |
1.66 |
||
Dr. Lal Path Labs Limited |
1.65 |
||
Information Technology |
8.92 |
-2.13 |
|
Infosys Limited |
4.53 |
-2.54 |
|
LTIMindtree Limited |
2.39 |
||
Tata Consultancy Services Limited |
1.98 |
-1.58 |
|
HCL Technologies Limited |
0.02 |
1.99 |
|
Metals & Mining |
2.59 |
-2.59 |
|
Tata Steel Limited |
2.38 |
-2.38 |
|
Adani Enterprises Limited |
0.21 |
-0.21 |
|
Oil Gas & Consumable Fuels |
5.30 |
-3.18 |
|
Reliance Industries Limited |
5.30 |
-3.18 |
|
Others |
1.31 |
||
Nifty 50 Index |
1.31 |
||
Power |
1.35 |
||
NTPC Limited |
0.68 |
||
Power Grid Corporation of India Limited |
0.67 |
||
Telecommunication |
2.44 |
||
Bharti Airtel Limited |
2.44 |
||
Name of the Instrument |
Ratings |
% to NAV |
|
Debt Instrument |
|||
Certificate of Deposit |
0.53 |
||
HDFC Bank Limited |
CARE A1+ |
0.53 |
|
Corporate Bond |
7.01 |
||
National Bank For Agriculture and Rural Development |
ICRA AAA |
3.95 |
|
Power Finance Corporation Limited |
CRISIL AAA |
1.73 |
|
Bharat Petroleum Corporation Limited |
CRISIL AAA |
1.34 |
|
Government Bond |
7.85 |
||
6.89% GOI (MD 16/01/2025) |
SOVEREIGN |
7.85 |
|
Short Term Debt & Net Current Assets |
11.73 |
Top Ten Holdings
Value of Investment of 10,000 |
||||||
| Period | Fund Returns (%) |
Benchmark Returns (%) |
Additional Benchmark Returns (%) |
Fund () |
Benchmark () |
Additional Benchmark () |
Regular - Growth |
||||||
| Last 1 Year | 11.42% |
15.66% |
22.91% |
11,142 |
11,566 |
12,291 |
| Last 3 Years | 9.67% |
14.72% |
24.54% |
13,191 |
15,099 |
19,315 |
| Since Inception | 3.36% |
11.65% |
15.25% |
11,226 |
14,705 |
16,431 |
Direct - Growth |
||||||
| Last 1 Year | 13.66% |
15.66% |
22.91% |
11,366 |
11,566 |
12,291 |
| Last 3 Years | 12.01% |
14.72% |
24.54% |
14,052 |
15,099 |
19,315 |
| Since Inception | 5.56% |
11.65% |
15.25% |
12,086 |
14,705 |
16,431 |
Past performance may or may not be sustained in future. Different Plans i.e. Regular Plan and Direct Plan under the scheme have different expense structure. Benchmark: Nifty 50 Hybrid Composite Debt 50:50 IndexAdditional Benchmark: Nifty 50 TRI. Fund Managers: Mr. Dhimant Shah (Managing since 08-August-22), Mr. Rohan Korde (Managing since 01-December-2022) and Mr. Vikrant Mehta (Managing since 10-Feb-22). Inception date of the scheme (31-Dec-19). Face Value per unit: Rs. 10.
| Period | Amount Invested |
Fund Value () |
Fund Returns (%) |
Benchmark Value () |
Benchmark Returns (%) |
Additional Benchmark Value () |
Additional Benchmark Returns (%) |
Regular - Growth |
|||||||
| Last 1 Year | 120000 |
127980 |
12.65% |
128402 |
13.33% |
131535 |
18.43% |
| Last 3 Years | 360000 |
405084 |
7.84% |
421197 |
10.49% |
454309 |
15.75% |
| Since Inception | 420000 |
481244 |
7.75% |
514989 |
11.71% |
571532 |
17.92% |
Direct - Growth |
|||||||
| Last 1 Year | 120000 |
129408 |
14.96% |
128402 |
13.33% |
131535 |
18.43% |
| Last 3 Years | 360000 |
418838 |
10.11% |
421197 |
10.49% |
454309 |
15.75% |
| Since Inception | 420000 |
500439 |
10.02% |
514989 |
11.71% |
571532 |
17.92% |
Past performance may or may not be sustained in future. Different Plans i.e. Regular Plan and Direct Plan under the scheme have different expense structure. Benchmark: Nifty 50 Hybrid Composite Debt 50:50 IndexAdditional Benchmark: Nifty 50 TRI. Additional Benchmark: Nifty 50 Hybrid Composite Debt 50:50 Index. For SIP returns, monthly investment of Rs.10,000 invested on the 1st business day of every month has been considered. CAGR Returns (%) are computed after accounting for the cash flow by using the XIRR method (investment internal rate of return).
Disclaimer - Fund SIP Performance
The performance details provided herein are of Growth option under Direct and Regular Plans. The Fund(s) offer Systematic Investment Plan (SIP) facility. To illustrate the advantages of SIP investments, this is how your investments would have grown if you had invested say Rs. 10,000 systematically on the first Business Day of every month over a period of time in the Growth Option of respective scheme. The returns are calculated by XIRR approach assuming investment of 10,000/- on the 1st working day of every month. XIRR helps in calculating return on investments given an initial and final value and a series of cash inflows and outflows with correct allowance for the time impact of the transactions.
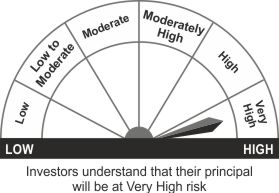
THIS PRODUCT IS SUITABLE FOR INVESTORS WHO ARE SEEKING^
- Capital appreciation while generating income over medium to long term
- Dynamic Asset allocation between equity, equity related Instruments and fixed income instruments so as to provide with long term capital appreciation
^Investors should consult their financial advisers if in doubt about whether the product is suitable for them.
Face Value per Unit: Rs. 10 unless other wise specified; Data is as of June 30, 2023 unless other wise specified.
Mutual Fund investments are subject to market risks, read all scheme related documents carefully