| CATEGORY OF SCHEME | ELSS Fund |
| INVESTMENT OBJECTIVE | To provide long-term capital appreciation by investing predominantly in equity and equity related securities. However, there is no assurance or guarantee that the investment objective of the Scheme will be achieved. The scheme does not assure or guarantee any returns. |
| Inception Date (Date of Allotment): | 18-Oct-19 |
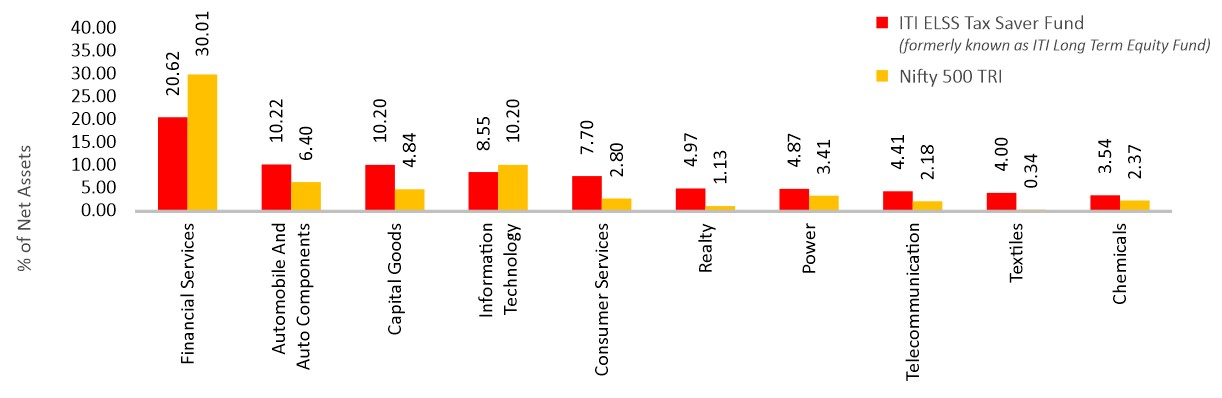
| Benchmark: | Nifty 500 TRI |
| Minimum Application Amount: | Rs. 500/- and in multiples of Rs. 500/- thereafter |
| Load Structure: | Entry Load: Nil Exit Load: Nil |
| Total Expense Ratio (TER): | Including Additional Expenses and Goods and Service
Tax on Management Fees |
| Fund Manager | Mr. Vishal Jajoo (Since 05 May 2023) Total Experience: 15 years Mr. Dhimant Shah (Since 01 December 2022) Total Experience : 26 years |
| AUM (in Rs. Cr): | 251.09 |
| AAUM (in Rs. Cr): | 242.66 |
| % of top 5 holdings: | 17.53% |
| % of top 10 holdings: | 31.08% |
| No. of scrips: | 59 |
| Standard Deviation^: | 13.86% |
| Beta^: | 0.88 |
| Sharpe Ratio^*: | 0.85 |
| Average P/B | 7.05 |
| Average P/E | 45.56 |
| ^Computed for the 3-yr period ended December 29,
2023. Based on daily NAV. * Risk free rate: 6.90 (Source: FIMMDA MIBOR) |
|
Regular Plan
(in Rs.) |
Direct Plan
(in Rs.) |
|
| Growth: | 19.5575 |
21.3357 |
| IDCW: | 18.7022 |
20.4265 |
Name of the Instrument |
% to
NAV |
% to NAV
Derivatives |
|
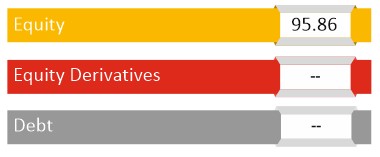
Equity & Equity Related Total |
95.86 |
||
Automobile and Auto Components |
10.22 |
||
LG Balakrishnan & Bros Limited |
2.41 |
||
CEAT Limited |
2.02 |
||
TVS Motor Company Limited |
1.70 |
||
TVS Srichakra Limited |
1.31 |
||
Tata Motors Limited |
1.17 |
||
Maruti Suzuki India Limited |
0.82 |
||
ZF Commercial Vehicle Control Systems India Limited |
0.78 |
||
Capital Goods |
10.20 |
||
KEI Industries Limited |
2.09 |
||
Ratnamani Metals & Tubes Limited |
2.05 |
||
Hi-Tech Pipes Limited |
1.51 |
||
Bharat Dynamics Limited |
1.22 |
||
AIA Engineering Limited |
1.00 |
||
Bharat Electronics Limited |
0.87 |
||
Prince Pipes And Fittings Limited |
0.79 |
||
Hindustan Aeronautics Limited |
0.67 |
||
Chemicals |
3.54 |
||
EID Parry India Limited |
1.89 |
||
PCBL Limited |
1.00 |
||
Pidilite Industries Limited |
0.65 |
||
Construction |
2.45 |
||
Larsen & Toubro Limited |
2.45 |
||
Construction Materials |
1.94 |
||
UltraTech Cement Limited |
1.94 |
||
Consumer Durables |
1.67 |
||
Titan Company Limited |
1.67 |
||
Consumer Services |
7.70 |
||
Zomato Limited |
3.29 |
||
Trent Limited |
3.14 |
||
Avenue Supermarts Limited |
1.26 |
||
Fast Moving Consumer Goods |
0.91 |
||
ITC Limited |
0.91 |
||
Financial Services |
20.62 |
||
HDFC Bank Limited |
3.45 |
||
ICICI Bank Limited |
2.87 |
||
Bajaj Finance Limited |
2.66 |
||
Cholamandalam Investment and Finance Company Ltd |
2.65 |
||
Axis Bank Limited |
1.32 |
||
CreditAccess Grameen Limited |
1.29 |
||
India Shelter Finance Corporation Limited |
1.18 |
||
Indian Bank |
1.17 |
||
Suryoday Small Finance Bank Limited |
1.17 |
||
HDFC Life Insurance Company Limited |
1.13 |
||
Max Financial Services Limited |
1.09 |
||
Ujjivan Financial Services Limited |
0.64 |
||
Forest Materials |
1.54 |
||
Century Textiles & Industries Limited |
1.54 |
||
Healthcare |
1.26 |
||
Suven Pharmaceuticals Limited |
1.26 |
||
Information Technology |
8.55 |
||
LTIMindtree Limited |
2.52 |
||
Coforge Limited |
2.01 |
||
Tata Consultancy Services Limited |
1.10 |
||
KPIT Technologies Limited |
1.03 |
||
Cyient Limited |
0.90 |
||
Infosys Limited |
0.65 |
||
Tech Mahindra Limited |
0.34 |
||
Metals & Mining |
3.23 |
||
Jindal Stainless Limited |
3.23 |
||
Oil Gas & Consumable Fuels |
1.58 |
||
Reliance Industries Limited |
1.58 |
||
Power |
4.87 |
||
NTPC Limited |
2.49 |
||
NLC India Limited |
2.38 |
||
Realty |
4.97 |
||
The Phoenix Mills Limited |
1.62 |
||
Sobha Limited |
1.35 |
||
Arvind SmartSpaces Limited |
1.09 |
||
DLF Limited |
0.90 |
||
Services |
2.20 |
||
InterGlobe Aviation Limited |
2.20 |
||
Telecommunication |
4.41 |
||
Bharti Airtel Limited |
4.41 |
||
Textiles |
4.00 |
||
Arvind Limited |
2.85 |
||
K.P.R. Mill Limited |
0.72 |
||
Nitin Spinners Limited |
0.44 |
||
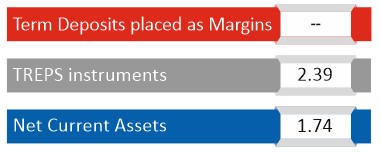
Short Term Debt & Net Current Assets |
4.14 |
Top Ten Holdings
Value of Investment of 10,000 |
||||||
| Period | Fund Returns (%) |
Benchmark Returns (%) |
Additional Benchmark Returns (%) |
Fund () |
Benchmark () |
Additional Benchmark () |
Regular - Growth |
||||||
| Last 1 Year | 36.6% |
27.0% |
21.4% |
13,652 |
12,691 |
12,130 |
| Last 3 Years | 18.6% |
20.3% |
17.2% |
16,652 |
17,411 |
16,101 |
| Since Inception | 17.3% |
19.9% |
17.3% |
19,558 |
21,399 |
19,530 |
Direct - Growth |
||||||
| Last 1 Year | 39.2% |
27.0% |
21.4% |
13,906 |
12,691 |
12,130 |
| Last 3 Years | 21.0% |
20.3% |
17.2% |
17,693 |
17,411 |
16,101 |
| Since Inception | 19.8% |
19.9% |
17.3% |
21,336 |
21,399 |
19,530 |
Past performance may or may not be sustained in future and is not a guarantee of any future returns, and should not be used as a basis of comparison with other investments. The performance data for 5 years period has not been provided, since scheme is in existence for less than 5 years. In case, the start / end date of the concerned period is a non-business date (NBD), the NAV of the previous date is considered for computation of returns. Different Plans i.e. Regular Plan and Direct Plan under the scheme have different expense structure. Benchmark: Nifty 500 TRI Additional Benchmark: Nifty 50 TRI. Fund Managers: Mr. Vishal Jajoo (Managing since 05-May-2023) and Mr. Dhimant Shah (Managing since 01- December - 2022). Inception date of the scheme (18-Oct-19). Face Value per unit: Rs. 10.
| Period | Amount Invested |
Fund Value () |
Fund Returns (%) |
Benchmark Value () |
Benchmark Returns (%) |
Additional Benchmark Value () |
Additional Benchmark Returns (%) |
Regular - Growth |
|||||||
| Last 1 Year |
1,20,000 |
1,53,441 |
56.1% |
1,46,065 |
43.1% |
1,40,517 |
33.5% |
| Last 3 Year |
3,60,000 |
4,99,445 |
22.5% |
4,86,320 |
20.6% |
4,65,528 |
17.5% |
| Since Inception |
5,00,000 |
7,86,482 |
22.2% |
8,01,094 |
23.1% |
7,55,421 |
20.1% |
Direct - Growth |
|||||||
| Last 1 Year |
1,20,000 |
1,55,004 |
58.9% |
1,46,065 |
43.1% |
1,40,517 |
33.5% |
| Last 3 Year |
3,60,000 |
5,15,178 |
24.8% |
4,86,320 |
20.6% |
4,65,528 |
17.5% |
| Since Inception |
5,00,000 |
8,24,380 |
24.6% |
8,01,094 |
23.1% |
7,55,421 |
20.1% |
Past performance may or may not be sustained in future and is not a guarantee of future returns. Different Plans i.e. Regular Plan and Direct Plan under the scheme have different expense structure. Benchmark: Nifty 500 TRI Additional Benchmark: Nifty 50 TRI. For SIP returns, monthly investment of Rs.10,000 invested on the 1st business day of every month has been considered. CAGR Returns (%) are computed after accounting for the cash flow by using the XIRR method (investment internal rate of return).
Disclaimer - Fund SIP Performance
The performance details provided herein are of Growth option under Direct and Regular Plans. The Fund(s) offer Systematic Investment Plan (SIP) facility. To illustrate the advantages of SIP investments, this is how your investments would have grown if you had invested say Rs. 10,000 systematically on the first Business Day of every month over a period of time in the Growth Option of respective scheme. The returns are calculated by XIRR approach assuming investment of 10,000/- on the 1st working day of every month. XIRR helps in calculating return on investments given an initial and final value and a series of cash inflows and outflows with correct allowance for the time impact of the transactions.
Record Date |
Plan(s) Option(s) |
Individuals/ HUF (IDCW) (Rs per unit) |
Others (IDCW) (Rs per unit) |
Cum-IDCW NAV (Rs per unit) |
22-Dec-20 |
Regular Plan - Dividend Option |
0.5000 |
0.5000 |
11.4328 |
22-Dec-20 |
Direct Plan - Dividend Option |
0.5000 |
0.5000 |
11.7326 |
Pursuant to payment of IDCW, the NAV of the IDCW Option(s) of the Scheme/Plan(s) falls to the extent of payout and statutory levy, if any. Past performance may or may not be sustained in future and should not be used as a basis for comparison with other investments. For complete list of IDCW, visit www.itiamc.com.
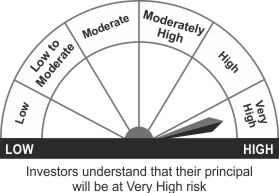
THIS PRODUCT IS SUITABLE FOR INVESTORS WHO ARE SEEKING^
- Capital appreciation over long term
- Investment in equity and equity related securities
^Investors should consult their financial advisers if in doubt about whether the product is suitable for them.
Face Value per Unit: Rs. 10 unless other wise specified; Data is as of December 29, 2023 unless other wise specified.
(*ITI Long Term Equity Fund name has been changed to ITI ELSS T ax Saver Fund with effect from October 30, 2023.)
Mutual Fund investments are subject to market risks, read all scheme related documents carefully