| CATEGORY OF SCHEME | Sectoral/Thematic |
| INVESTMENT OBJECTIVE | The investment objective of the scheme is to seek to generate long term capital appreciation through investing in equity and equity related securities of companies engaged in Pharma and Healthcare. However, there can be no assurance that the investment objective of the scheme would be achieved. |
| Inception Date (Date of Allotment): | 08-Nov-21 |
| Benchmark: | Nifty Healthcare TRI |
| Minimum Application Amount: | Rs.5,000/- and in multiples of Rs. 1/- thereafter |
| Load Structure: | Entry Load: Nil Exit Load: If redeemed/Switched out on or before 3 Months from the date of allotment; Exit Load is 0.50% Exit Load after completion of 3 months - NIL |
| Total Expense Ratio (TER): | Including Additional Expenses and Goods and Service
Tax on Management Fees |
| Fund Manager | Mr. Rohan Korde (Since 08-Nov-21) |
| AUM (in Rs. Cr): | 230.85 |
| AAUM (in Rs. Cr): | 231.67 |
| % of top 5 holdings: | 37.94% |
| % of top 10 holdings: | 55.48% |
| No. of scrips: | 40 |
| Standard Deviation^: | 13.18% |
| Beta^: | 0.87 |
| Sharpe Ratio^*: | 0.98 |
| Average P/B | 9.64 |
| Average P/E | 51.05 |
| Portfolio Turnover Ratio | 0.49 |
| ^Computed for the 3-yr period ended November 30, 2025. Based on monthly return. *Risk free rate: 5.59 (Source: FIMMDA MIBOR) |
|
Regular Plan
(in Rs.) |
Direct Plan
(in Rs.) |
|
| Growth: | 16.1874 |
17.5718 |
| IDCW: | 16.1874 |
17.5718 |
Name of the Instrument |
% to
NAV |
% to NAV
Derivatives |
|
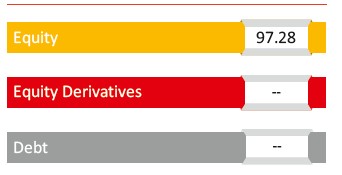
Equity & Equity Related Total |
97.28 |
||
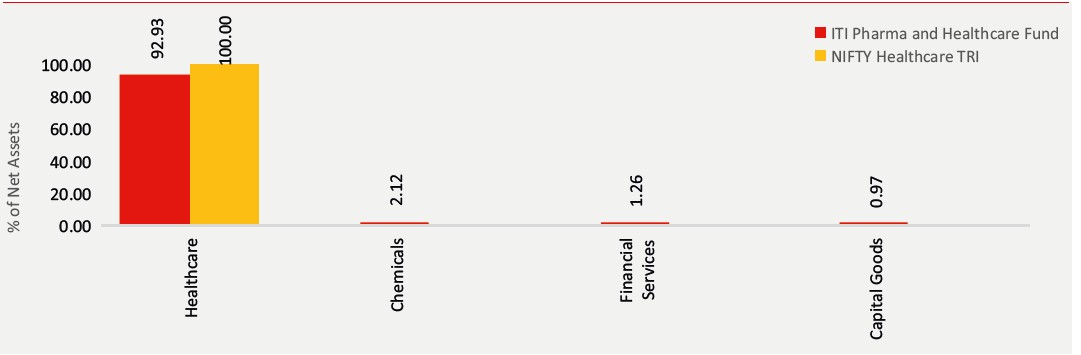
Capital Goods |
0.97 |
||
Standard Glass Lining Technology Ltd |
0.97 |
||
Chemicals |
2.12 |
||
Sumitomo Chemical India Limited |
1.31 |
||
Linde India Limited |
0.81 |
||
Financial Services |
1.26 |
||
SBI Life Insurance Company Limited |
1.26 |
||
Healthcare |
92.93 |
||
Sun Pharmaceutical Industries Limited |
12.73 |
||
Divi's Laboratories Limited |
8.75 |
||
Apollo Hospitals Enterprise Limited |
6.12 |
||
Max Healthcare Institute Limited |
6.08 |
||
Torrent Pharmaceuticals Limited |
4.26 |
||
Aurobindo Pharma Limited |
4.02 |
||
Fortis Healthcare Limited |
3.60 |
||
Cohance Lifesciences Limited |
3.58 |
||
Lupin Limited |
3.25 |
||
Aster DM Healthcare Limited |
3.09 |
||
Alkem Laboratories Limited |
3.07 |
||
Neuland Laboratories Limited |
2.98 |
||
Abbott India Limited |
2.30 |
||
Wockhardt Limited |
2.20 |
||
Cipla Limited |
1.91 |
||
Laurus Labs Limited |
1.85 |
||
Glenmark Pharmaceuticals Limited |
1.80 |
||
Healthcare Global Enterprises Limited |
1.75 |
||
Dr. Reddy's Laboratories Limited |
1.72 |
||
Mankind Pharma Limited |
1.71 |
||
Sai Life Sciences Limited |
1.52 |
||
IPCA Laboratories Limited |
1.42 |
||
FDC Limited |
1.37 |
||
Orchid Pharma Limited |
1.31 |
||
Biocon Limited |
1.31 |
||
Rainbow Childrens Medicare Limited |
1.18 |
||
Piramal Pharma Limited |
1.06 |
||
GlaxoSmithKline Pharmaceuticals Limited |
1.03 |
||
Onesource Specialty Pharma Limited |
0.99 |
||
Poly Medicure Limited |
0.91 |
||
Caplin Point Laboratories Limited |
0.86 |
||
Supriya Lifescience Limited |
0.82 |
||
Shilpa Medicare Limited |
0.73 |
||
Zydus Lifesciences Limited |
0.69 |
||
AstraZeneca Pharma India Limited |
0.49 |
||
Syngene International Limited |
0.48 |
||
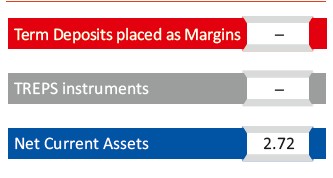
Short Term Debt & Net Current Assets |
2.72 |
|
Top Ten Holdings
| Period | Fund Returns (%) |
Benchmark Returns (%) |
Additional Benchmark Returns (%) |
Benchmark (Rs) |
Fund (Rs) |
Additional Benchmark Returns (Rs) |
Regular - Growth |
||||||
| Last 1 Year | -5.35% |
7.06% |
9.97% |
9,467 |
10,704 |
10,994 |
| Last 3 Years | 18.50% |
22.32% |
13.10% |
16,630 |
18,290 |
14,461 |
| Since Inception | 12.60% |
15.41% |
10.91% |
16,187 |
17,888 |
15,222 |
Direct - Growth |
||||||
| Last 1 Year | -3.54% |
7.06% |
9.97% |
9,647 |
10,704 |
10,994 |
| Last 3 Years | 20.82% |
22.32% |
13.10% |
17,626 |
18,290 |
14,461 |
| Since Inception | 14.90% |
15.41% |
10.91% |
17,572 |
17,888 |
15,222 |
Past performance may or may not be sustained in future and is not a guarantee of any future returns, and should not be used as a basis of comparison with other investments. The performance data for 5 years period has not been provided, since scheme is in existence for less than 5 years. In case, the start / end date of the concerned period is a non-business date (NBD), the NAV of the previous date is considered for computation of returns. Different Plans i.e. Regular Plan and Direct Plan under the scheme have different expense structure. Benchmark: Nifty Healthcare TRI Additional Benchmark: Nifty 50 TRI. Fund Managers: Mr. Rohan Korde (Managing since 08-Nov-21) and Mr. Dhimant Shah (Managing since 01-December-22). Inception date of the scheme is (08-Nov-2021). Face Value per unit: Rs. 10. ITI Pharma & Healthcare Fund NAV as on November 28, 2025: Rs. 16.1874 (Regular Growth Option), Rs. 17.5718 (Direct Growth Option)
| Period | Amount Invested |
Fund Returns (%) |
Benchmark Returns (%) |
Additional Benchmark Returns (%) |
Fund Value () |
Benchmark Value () |
Additional Benchmark Value () |
Regular - Growth |
|||||||
| Last 1 Year |
1,20,000 |
1.10% |
13.06% |
17.34% |
1,20,701 |
1,28,174 |
1,30,795 |
| Last 3 Years |
3,60,000 |
16.07% |
21.48% |
14.21% |
4,56,222 |
4,92,101 |
4,44,280 |
| Since Inception |
4,90,000 |
16.18% |
20.20% |
14.01% |
6,79,329 |
7,34,752 |
6,50,888 |
Direct - Growth |
|||||||
| Last 1 Year |
1,20,000 |
3.03% |
13.06% |
17.34% |
1,21,923 |
1,28,174 |
1,30,795 |
| Last3 Years |
3,60,000 |
18.41% |
21.48% |
14.21% |
4,71,518 |
4,92,101 |
4,44,280 |
| Since Inception |
4,90,000 |
18.50% |
20.20% |
14.01% |
7,10,982 |
7,34,752 |
6,50,888 |
Past performance may or may not be sustained in future and is not a guarantee of any future returns, and should not be used as a basis of comparison with other investments. Different Plans i.e. Regular Plan and Direct Plan under the scheme have different expense structure. Benchmark: Nifty Healthcare TRI Additional Benchmark: Nifty 50 TRI. For SIP returns, monthly investment of Rs.10,000 invested on the 1st business day of every month has been considered. CAGR Returns (%) are computed after accounting for the cash flow by using the XIRR method (investment internal rate of return).
THIS PRODUCT IS SUITABLE FOR INVESTORS WHO ARE SEEKING^
- Capital appreciation over long term
- Investments in equity and equity related securities of companies engaged in Pharma and Healthcare.
^Investors should consult their financial advisers if in doubt about whether the product is suitable for them.
Face Value per Unit: Rs. 10 unless other wise specified; Data is as of November 30, 2025 unless other wise specified.
Mutual Fund investments are subject to market risks, read all scheme related documents carefully