| CATEGORY OF SCHEME | Arbitrage Fund |
| INVESTMENT OBJECTIVE | The investment objective of the Scheme is to generate income by predominantly investing in arbitrage opportunities in the cash and the derivative segments of the equity markets and the arbitrage opportunities available within the derivative segment and by investing the balance in debt and money market instruments. However, there is no assurance that the investment objective of the scheme will be realized. |
| Inception Date (Date of Allotment): | 09-Sep-19 |
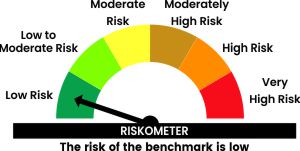
| Benchmark: | Nifty 50 Arbitrage Index |
| Minimum Application Amount: | Rs.5,000/- and in multiples of Rs. 1/- thereafter |
| Load Structure: | Entry Load: Nil Exit Load: 10% of the units allotted may be redeemed without any exit load, on or before completion of 15 days from the date of allotment of units. Any redemption in excess of such limit in the first 15 days from the date of allotment shall be subject to the following exit load: i. 0.25% if redeemed or switched out on or before completion of 15 days from the date of allotment of units ii. Nil, if redeemed or switched out after completion of 15 days from the date of allotment of units. |
| Total Expense Ratio (TER): | Including Additional Expenses and Goods and Service
Tax on Management Fees |
| Fund Manager* | Mr Vikas Nathani (Since 01-Jan-24) Total Experience: 18 years Mr. Rohan Korde (Since 15-Nov-24) Total Experience: 17 years Mr. Laukik Bagwe (Since 01-Feb-25) Total experience: 25 years |
| AUM (in Rs. Cr): | 50.35 |
| AAUM (in Rs. Cr): | 51.17 |
| Standard Deviation^: | 0.96% |
| Beta^: | 0.49 |
| Sharpe Ratio^*: | 1.09 |
| **Risk free rate: 5.59 (Source: FIMMDA MIBOR) | |
Regular Plan
(in Rs.) |
Direct Plan
(in Rs.) |
|
| Growth: | 13.2498 |
13.8784 |
| IDCW: | 13.2498 |
13.8784 |
Name of the Instrument |
% to
NAV |
% to NAV
Derivatives |
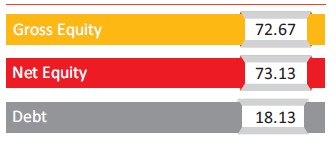
Equity & Equity Related Total |
72.67 |
-73.13 |
Capital Goods |
4.42 |
-4.45 |
Cummins India Limited |
2.31 |
-2.32 |
Suzlon Energy Limited |
1.20 |
-1.21 |
CG Power and Industrial Solutions Limited |
0.91 |
-0.91 |
Construction |
1.70 |
-1.71 |
Larsen & Toubro Limited |
1.70 |
-1.71 |
Construction Materials |
2.64 |
-2.65 |
Ambuja Cements Limited |
2.64 |
-2.65 |
Consumer Durables |
0.99 |
-0.99 |
PG Electroplast Limited |
0.99 |
-0.99 |
Consumer Services |
3.97 |
-3.99 |
Eternal Limited |
2.02 |
-2.04 |
Trent Limited |
1.94 |
-1.96 |
Financial Services |
40.89 |
-41.14 |
One 97 Communications Limited |
7.61 |
-7.66 |
Multi Commodity Exchange of India Limited |
7.50 |
-7.55 |
Power Finance Corporation Limited |
6.09 |
-6.13 |
REC Limited |
3.93 |
-3.95 |
IndusInd Bank Limited |
3.58 |
-3.60 |
IIFL Finance Limited |
2.47 |
-2.48 |
PNB Housing Finance Limited |
2.10 |
-2.12 |
ICICI Bank Limited |
1.35 |
-1.36 |
Jio Financial Services Limited |
1.29 |
-1.29 |
IDFC First Bank Limited |
1.18 |
-1.19 |
ICICI Prudential Life Insurance Company Limited |
1.02 |
-1.03 |
HDFC Life Insurance Company Limited |
1.00 |
-1.01 |
Shriram Finance Limited |
0.98 |
-0.98 |
Punjab National Bank |
0.79 |
-0.80 |
Information Technology |
3.28 |
-3.30 |
Persistent Systems Limited |
3.28 |
-3.30 |
Metals & Mining |
8.82 |
-8.88 |
Vedanta Limited |
3.72 |
-3.75 |
Hindustan Zinc Limited |
3.19 |
-3.21 |
Hindalco Industries Limited |
1.01 |
-1.02 |
NMDC Limited |
0.89 |
-0.90 |
Power |
1.26 |
-1.27 |
JSW Energy Limited |
1.26 |
-1.27 |
Realty |
0.85 |
-0.85 |
The Phoenix Mills Limited |
0.85 |
-0.85 |
Services |
3.86 |
-3.89 |
Adani Ports and Special Economic Zone Limited |
3.86 |
-3.89 |
Mutual Fund Units |
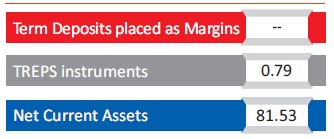
18.13 |
|
ITI Liquid Fund - Direct Plan - Growth Option |
18.13 |
|
Short Term Debt & Net Current Assets |
9.20 |
|
|
Value of Investment of 10,000 |
||||||
| Period | Fund Returns (%) |
Benchmark Returns (%) |
Additional Benchmark Returns (%) |
Fund () |
Benchmark () |
Additional Benchmark () |
Regular - Growth |
||||||
| Last 1 Year | 6.51% |
7.58% |
6.41% |
10,649 |
10,756 |
10,639 |
| Last 3 Years | 6.65% |
7.65% |
6.98% |
12,128 |
12,471 |
12,241 |
| Last 5 Years | 4.91% |
6.19% |
5.62% |
12,709 |
13,506 |
13,146 |
| Since Inception | 4.62% |
5.53% |
5.75% |
13,250 |
13,979 |
14,164 |
Direct - Growth |
||||||
| Last 1 Year | 7.28% |
7.58% |
6.41% |
10,725 |
10,756 |
10,639 |
| Last 3 Years | 7.43% |
7.65% |
6.98% |
12,397 |
12,471 |
12,241 |
| Last 5 Years | 5.69% |
6.19% |
5.62% |
13,191 |
13,506 |
13,146 |
| Since Inception | 5.41% |
5.53% |
5.75% |
13,878 |
13,979 |
14,164 |
Past performance may or may not be sustained in future and is not a guarantee of any future returns, and should not be used as a basis of comparison with other investments. In case, the start / end date of the concerned period is a non-business date (NBD), the NAV of the previous date is considered for computation of returns. Different Plans i.e. Regular Plan and Direct Plan under the scheme have different expense structure. Benchmark: Nifty 50 Arbitrage Index Additional Benchmark: CRISIL 1 Year T-Bill Index. Fund Managers: Mr Vikas Nathani (Managing Since 01-Jan-24), Mr. Rohan Korde (Managing Since 14-Nov-24) and Mr. Laukik Bagwe (Since 01-Feb-25). Inception date of the scheme (09-Sep-19). Face Value per unit: Rs. 10. IITI Arbitrage Fund Fund NAV as on November 28, 2025: Rs. 13.2498 (Regular Growth Option), Rs. 13.8784 (Direct Growth Option)
| Period | Amount Invested |
Fund Returns (%) |
Benchmark Returns (%) |
Additional Benchmark Returns (%) |
Fund Value () |
Benchmark Value () |
Additional Benchmark Value () |
Regular - Growth |
|||||||
| Last 1 Year |
1,20,000 |
6.06% |
7.20% |
5.75% |
1,23,833 |
1,24,545 |
1,23,638 |
| Last 3 Years |
3,60,000 |
6.68% |
7.51% |
6.81% |
3,98,130 |
4,03,052 |
3,98,891 |
| Last 5 Years |
6,00,000 |
5.89% |
6.95% |
6.36% |
6,96,001 |
7,14,766 |
7,04,311 |
| Since Inception |
7,50,000 |
5.42% |
6.47% |
6.07% |
8,90,042 |
9,20,185 |
9,08,712 |
Direct - Growth |
|||||||
| Last 1 Year |
1,20,000 |
6.82% |
7.20% |
5.75% |
1,24,311 |
1,24,545 |
1,23,638 |
| Last 3 Years |
3,60,000 |
7.45% |
7.51% |
6.81% |
4,02,736 |
4,03,052 |
3,98,891 |
| Last 5 Years |
6,00,000 |
6.67% |
6.95% |
6.36% |
7,09,665 |
7,14,766 |
7,04,311 |
| Since Inception |
7,50,000 |
6.19% |
6.47% |
6.07% |
9,12,058 |
9,20,185 |
9,08,712 |
Past performance may or may not be sustained in future and is not a guarantee of any future returns, and should not be used as a basis of comparison with other investments. Different Plans i.e. Regular Plan and Direct Plan under the scheme have different expense structure. Benchmark: Nifty 50 Arbitrage Index Additional Benchmark: CRISIL 1 Year T-Bill Index. For SIP returns, monthly investment of Rs.10,000 invested on the 1st business day of every month has been considered. CAGR Returns (%) are computed after accounting for the cash flow by using the XIRR method (investment internal rate of return).
Disclaimer - Fund SIP Performance
The performance details provided herein are of Growth option under Direct and Regular Plans. The Fund(s) offer Systematic Investment Plan (SIP) facility. To illustrate the advantages of SIP investments, this is how your investments would have grown if you had invested say Rs. 10,000 systematically on the first Business Day of every month over a period of time in the Growth Option of respective scheme. The returns are calculated by XIRR approach assuming investment of 10,000/- on the 1st working day of every month. XIRR helps in calculating return on investments given an initial and final value and a series of cash inflows and outflows with correct allowance for the time impact of the transactions.
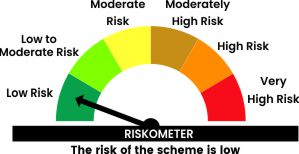
THIS PRODUCT IS SUITABLE FOR INVESTORS WHO ARE SEEKING^
- To generate income by predominantly investing in arbitrage opportunities
- Investments predominantly in arbitrage opportunities in the cash and derivative segments of the equity markets and the arbitrage opportunities available within the derivative segment and by investing the balance in debt and money market instruments
^Investors should consult their financial advisers if in doubt about whether the product is suitable for them.
Face Value per Unit: Rs. 10 unless other wise specified; Data is as of November 28, 2025 unless other wise specified.
Mutual Fund investments are subject to market risks, read all scheme related documents carefully