| CATEGORY OF SCHEME | Flexi cap Fund |
| INVESTMENT OBJECTIVE | The investment objective of the scheme is to generate long-term capital appreciation from a diversified portfolio that dynamically invests in equity and equity-related securities of companies across various market capitalisation. However, there can be no assurance that the investment objective of the scheme would be achieved. |
| Inception Date (Date of Allotment): | 17th Feb 2023 |
| Benchmark: | Nifty 500 Total Return Index |
| Minimum Application Amount: | Rs. 5,000/- and in multiples of Rs. 1/- thereafter |
| Load Structure: | Entry Load: Nil Exit Load: If redeemed/Switched out on or before 3 Months from the date of allotment; Exit Load is 0.50% Exit Load after completion of 3 months - NIL |
| Total Expense Ratio (TER): | Including Additional Expenses and Goods and
Service Tax on Management Fees |
| Fund Manager | Mr. Dhimant Shah (Since 17-Feb-2023) |
| AUM (in Rs. Cr): | 1,247.29 |
| AAUM (in Rs. Cr): | 1,265.10 |
| % of top 5 holdings: | 19.92% |
| % of top 10 holdings: | 31.65% |
| No of scrips: | 72 |
| Standard Deviation^: | NA |
| Beta^: | NA |
| Sharpe Ratio^*: | NA |
| Average P/B | 7.02 |
| Average P/E | 29.44 |
| Portfolio Turnover Ratio | 1.15 |
^Scheme has not completed 3 years hence NA * Risk free rate: 5.53
(Source: FIMMDA MIBOR) |
|
Regular Plan
(in Rs.) |
Direct Plan
(in Rs.) |
|
| Growth: | 17.7159 |
18.6473 |
| IDCW: | 17.7159 |
18.6473 |
Name of the Instrument |
% to
NAV |
% to NAV
Derivatives |
|
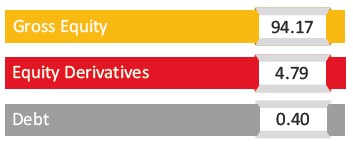
Equity & Equity Related Total |
94.17 |
4.79 |
|
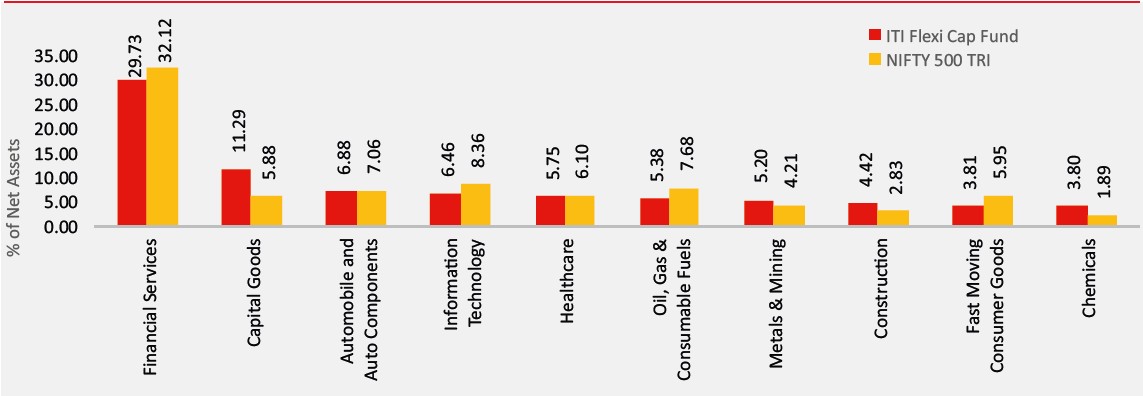
Automobile and Auto Components |
6.88 |
||
TVS Motor Company Limited |
1.48 |
||
Ather Energy Limited |
1.42 |
||
FIEM Industries Limited |
1.41 |
||
Maruti Suzuki India Limited |
1.33 |
||
Studds Accessories Ltd |
0.72 |
||
Bharat Forge Limited |
0.51 |
||
Capital Goods |
11.29 |
||
PTC Industries Limited |
1.57 |
||
Tata Motors Ltd |
1.15 |
||
Polycab India Limited |
1.14 |
||
Shakti Pumps (India) Limited |
1.08 |
||
Aditya Infotech Limited |
1.02 |
||
Bharat Electronics Limited |
0.99 |
||
Apar Industries Limited |
0.98 |
||
Tega Industries Limited |
0.93 |
||
Jyoti CNC Automation Ltd |
0.89 |
||
Vesuvius India Limited |
0.83 |
||
KSH International Limited |
0.69 |
||
Chemicals |
3.80 |
||
Navin Fluorine International Limited |
1.37 |
||
Linde India Limited |
1.27 |
||
Vishnu Chemicals Limited |
1.16 |
||
Construction |
4.42 |
||
Larsen & Toubro Limited |
2.44 |
||
Cemindia Projects Ltd |
1.08 |
||
Techno Electric & Engineering Company Limited |
0.90 |
||
Construction Materials |
2.20 |
||
UltraTech Cement Limited |
1.35 |
||
Ambuja Cements Limited |
0.85 |
||
Consumer Durables |
2.84 |
||
Dixon Technologies (India) Limited |
1.00 |
||
LG Electronics India Ltd |
1.00 |
||
Titan Company Limited |
0.83 |
||
Consumer Services |
2.91 |
||
The Indian Hotels Company Limited |
1.15 |
||
Urban Company Ltd. |
0.94 |
||
Eternal Limited |
0.82 |
||
Fast Moving Consumer Goods |
3.81 |
||
ITC Limited |
1.34 |
||
Varun Beverages Limited |
1.25 |
||
United Spirits Limited |
1.22 |
||
Financial Services |
27.57 |
2.16 |
|
HDFC Bank Limited |
5.52 |
||
ICICI Bank Limited |
4.94 |
||
State Bank of India |
2.40 |
||
Multi Commodity Exchange of India Limited |
2.22 |
||
Axis Bank Limited |
2.09 |
||
Kotak Mahindra Bank Limited |
1.58 |
||
The Federal Bank Limited |
1.40 |
||
Bajaj Finance Limited |
1.18 |
||
Cholamandalam Investment and Finance Company Ltd |
1.16 |
||
Manappuram Finance Limited |
1.11 |
||
Max Financial Services Limited |
1.07 |
||
Canara Bank |
1.00 |
||
Bank of Maharashtra |
0.82 |
||
Jio Financial Services Limited |
0.58 |
||
Bajaj Holdings & Investment Limited |
0.50 |
||
One 97 Communications Limited |
1.21 |
||
Bank of Baroda |
0.25 |
||
Shriram Finance Limited |
0.70 |
||
Healthcare |
5.75 |
||
Divi's Laboratories Limited |
1.49 |
||
Wockhardt Limited |
1.25 |
||
Sai Life Sciences Limited |
1.03 |
||
Sun Pharmaceutical Industries Limited |
1.01 |
||
Concord Biotech Limited |
0.98 |
||
Information Technology |
3.84 |
2.63 |
|
Tata Consultancy Services Limited |
1.42 |
||
Infosys Limited |
1.34 |
||
LTIMindtree Limited |
1.08 |
||
HCL Technologies Limited |
1.18 |
||
Persistent Systems Limited |
1.45 |
||
Metals & Mining |
5.20 |
||
Hindustan Copper Limited |
2.61 |
||
Vedanta Limited |
2.58 |
||
Oil Gas & Consumable Fuels |
5.38 |
||
Reliance Industries Limited |
4.02 |
||
Bharat Petroleum Corporation Limited |
1.36 |
||
Power |
1.73 |
||
NTPC Limited |
1.73 |
||
Realty |
0.61 |
||
Prestige Estates Projects Limited |
0.61 |
||
Services |
0.97 |
||
InterGlobe Aviation Limited |
0.97 |
||
Telecommunication |
2.82 |
||
Bharti Airtel Limited |
2.82 |
||
Textiles |
0.91 |
||
Arvind Limited |
0.91 |
||
Utilities |
1.26 |
||
VA Tech Wabag Limited |
1.26 |
|
|
Preference Shares |
0.02 |
||
TVS Motor Company Limited |
0.02 |
||
Mutual Fund Units |
0.40 |
||
ITI Banking & PSU Debt Fund -Direct Plan -Growth Option |
0.40 |
||
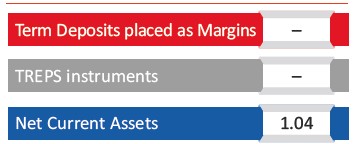
Short Term Debt & Net Current Assets |
0.62 |
|
Top Ten Holdings
| Period | Amount Invested |
Fund Value () |
Fund Returns (%) |
Benchmark Value () |
Benchmark Returns (%) |
Additional Benchmark Value () |
Regular - Growth |
||||||
| Last 1 Year | 8.69% |
8.00% |
9.00% |
10,866 |
10,798 |
10,897 |
| Since Inception | 21.36% |
16.80% |
13.68% |
17,716 |
15,818 |
14,604 |
Direct - Growth |
||||||
| Last 1 Year | 10.41% |
8.00% |
9.00% |
11,038 |
10,798 |
10,897 |
| Since Inception | 23.49% |
16.80% |
13.68% |
18,647 |
15,818 |
14,604 |
Past performance may or may not be sustained in future and is not a guarantee of any future returns, and should not be used as a basis of comparison with other investments. The performance data for 3 years period has not been provided, since scheme is in existence for less than 3 years. In case, the start / end date of the concerned period is a non-business date (NBD), the NAV of the previous date is considered for computation of returns. Different Plans i.e. Regular Plan and Direct Plan under the scheme have different expense structure. Benchmark: Nifty 500 TRI Additional Benchmark: Nifty 50 TRI. Fund Managers: Mr. Dhimant Shah (Managing since 17-Feb-2023) and Mr. Rohan Korde (Managing since 17-Feb-2023). Inception date of the scheme (17-Feb-23). Face Value per unit: Rs. 10. ITI Flexi Cap Fund NAV as on January 30, 2026: Rs. 17.7159 (Regular Growth Option), Rs. 18.6473 (Direct Growth Option)
| Period | Amount Invested |
Fund Returns (%) |
Benchmark Returns (%) |
Additional Benchmark Returns (%) |
Fund Value () |
Benchmark Value () |
Additional Benchmark Value () |
Regular - Growth |
|||||||
| Last 1 Year | 1,20,000 |
6.53% |
5.78% |
6.99% |
1,24,175 |
1,23,698 |
1,24,466 |
| Since Inception | 3,60,000 |
12.60% |
11.05% |
10.34% |
4,34,349 |
4,24,716 |
4,20,311 |
Direct - Growth |
|||||||
| Last 1 Year | 1,20,000 |
8.19% |
5.78% |
6.99% |
1,25,226 |
1,23,698 |
1,24,466 |
| Since Inception | 3,60,000 |
14.57% |
11.05% |
10.34% |
4,46,818 |
4,24,716 |
4,20,311 |
Past performance may or may not be sustained in future and is not a guarantee of any future returns, and should not be used as a basis of comparison with other investments. Different Plans i.e. Regular Plan and Direct Plan under the scheme have different expense structure. Benchmark: Nifty Healthcare TRI Additional Benchmark: Nifty 50 TRI. For SIP returns, monthly investment of Rs.10,000 invested on the 1st business day of every month has been considered. CAGR Returns (%) are computed after accounting for the cash flow by using the XIRR method (investment internal rate of return).
THIS PRODUCT IS SUITABLE FOR INVESTORS WHO ARE SEEKING^
- Capital appreciation over long term
- Investments in a diversified portfolio consisting of equity and equity related instruments across market capitalization
^Investors should consult their financial advisers if in doubt about whether the product is suitable for them.

Face Value per Unit: Rs. 10 unless other wise specified; Data is as of January 31, 2026 unless other wise specified.
Mutual Fund investments are subject to market risks, read all scheme related documents carefully