| CATEGORY OF SCHEME | Balanced Advantage |
| INVESTMENT OBJECTIVE | The investment objective of the Scheme is to seek capital appreciation by investing in equity and equity related securities and fixed income instruments. The allocation between equity instruments and fixed income will be managed dynamically so as to provide investors with long term capital appreciation. However, there can be no assurance that the investment objective of the scheme will be realized. |
| Inception Date (Date of Allotment): | 31-Dec-19 |
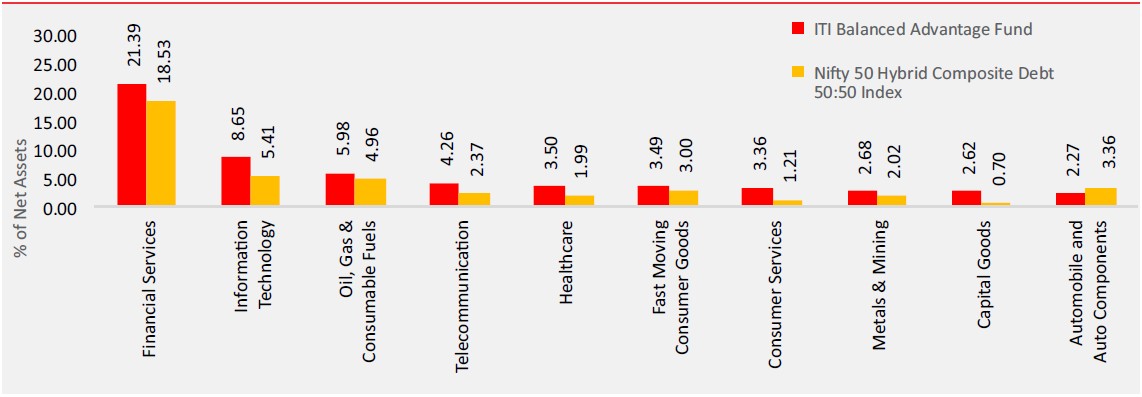
| Benchmark: | Nifty 50 Hybrid Composite Debt 50:50 Index |
| Minimum Application Amount: | Rs.5,000/- and in multiples of Rs. 1/- thereafter |
| Load Structure: | Entry Load: Nil 10% of the units allotted may be redeemed without any exit load, on or before completion of 3 months from the date of allotment of units. Any redemption in excess of such limit in the first 3 months from the date of allotment shall be subject to the following exit load: i. 0.50% if redeemed or switched out on or before completion of 3 months from the date of allotment of units ii. Nil, if redeemed or switched out after completion of 3 months from the date of allotment of units. |
| Total Expense Ratio (TER):* | Including Additional Expenses and Goods and Service
Tax on Management Fees Regular Plan: 2.39% Direct Plan: 0.65% |
| Fund Manager | Mr. Rajesh Bhatia (Since 15-Sep-23) Total Experience: 31 years Mr. Rohan Korde (Since 14-Nov-24) Total experience: 17 years Mr. Laukik Bagwe (Since 01-Feb-25) Total experience: 25 years Mr. Vasav Sahgal (Since 17-Feb-25) Total experience: 7 years |
| AUM (in Rs. Cr): | 381.39 |
| AAUM (in Rs. Cr): | 388.53 |
| % of top 5 holdings: | 22.55% |
| % of top 10 holdings: | 38.69% |
| No. of scrips: | 45 |
| Average Maturity: | 1.80 Years |
| Macaulay Duration: | 1.70 Years |
| Modified Duration: | 1.60 Years |
| Yield To Maturity (Regular & Direct) Plans : | 1.46% |
| Standard Deviation^: | 7.36% |
| Beta^: | 0.05 |
| Sharpe Ratio^*: | 0.75 |
| Average P/B | 4.46 |
| Average P/E |
|
| Portfolio Turnover Ratio | 3.16 |
^Computed for the 3-yr period ended January 30, 2026. Based on monthly return. *Risk free rate: 5.53 (Source: FIMMDA MIBOR) |
|
Regular Plan
(in Rs.) |
Direct Plan
(in Rs.) |
|
| Growth: | 14.3624 |
16.1758 |
| IDCW: | 12.2469 |
14.0137 |
Name of the Instrument |
% to NAV |
% to NAV Derivatives |
|
Equity & Equity Related Total |
66.99 |
-0.74 |
|
Automobile and Auto Components |
2.27 |
||
Mahindra & Mahindra Limited |
2.27 |
||
Capital Goods |
3.26 |
-0.64 |
|
Garware Hi-Tech Films Limited |
2.06 |
||
Cummins India Limited |
0.65 |
-0.64 |
|
GE Vernova T&D India Limited |
0.56 |
||
Chemicals |
1.48 |
||
UPL Limited |
1.48 |
||
Construction |
1.50 |
||
Larsen & Toubro Limited |
1.50 |
||
Construction Materials |
1.13 |
||
UltraTech Cement Limited |
1.13 |
||
Consumer Durables |
2.06 |
-2.05 |
|
Dixon Technologies (India) Limited |
1.05 |
-1.06 |
|
Amber Enterprises India Limited |
1.00 |
-0.99 |
|
Consumer Services |
3.36 |
||
Swiggy Limited |
1.91 |
||
Eternal Limited |
1.45 |
||
Fast Moving Consumer Goods |
3.49 |
||
Varun Beverages Limited |
1.51 |
||
ITC Limited |
1.46 |
||
Tata Consumer Products Limited |
0.52 |
||
Financial Services |
19.39 |
2.00 |
|
HDFC Bank Limited |
4.22 |
||
ICICI Bank Limited |
3.58 |
2.00 |
|
State Bank of India |
2.41 |
||
Bajaj Finance Limited |
2.17 |
||
Shriram Finance Limited |
2.11 |
||
Axis Bank Limited |
1.22 |
||
SBI Life Insurance Company Limited |
1.14 |
||
One 97 Communications Limited |
1.07 |
||
ICICI Lombard General Insurance Company Limited |
0.97 |
||
BSE Limited |
0.50 |
||
Healthcare |
5.51 |
-2.01 |
|
Laurus Labs Limited |
2.02 |
-2.01 |
|
Wockhardt Limited |
1.92 |
||
Glenmark Pharmaceuticals Limited |
1.05 |
||
Apollo Hospitals Enterprise Limited |
0.52 |
||
Information Technology |
8.65 |
||
Infosys Limited |
3.19 |
||
Tata Consultancy Services Limited |
1.59 |
||
Sagility Limited |
1.38 |
||
HCL Technologies Limited |
1.03 |
||
LTIMindtree Limited |
0.50 |
||
Mphasis Limited |
0.49 |
||
KPIT Technologies Limited |
0.47 |
||
Metals & Mining |
2.68 |
||
Vedanta Limited |
2.18 |
||
NMDC Limited |
0.50 |
||
Oil Gas & Consumable Fuels |
5.98 |
||
Reliance Industries Limited |
4.24 |
||
Bharat Petroleum Corporation Limited |
0.74 |
||
Oil & Natural Gas Corporation Limited |
0.50 |
||
Coal India Limited |
0.50 |
||
Others |
1.00 |
||
Nifty Index |
1.00 |
||
Power |
0.99 |
||
NTPC Limited |
0.99 |
||
Realty |
0.97 |
||
Godrej Properties Limited |
0.97 |
||
Telecommunication |
4.26 |
||
Bharti Airtel Limited |
4.26 |
||
Textiles |
0.98 |
||
Page Industries Limited |
0.98 |
||
|
|||
Name of the Instrument |
Ratings |
% to NAV |
|
Corporate Bond |
17.18 |
||
National Bank For Agriculture and Rural Development |
CRISIL AAA |
5.81 |
|
Power Grid Corporation of India Limited |
CRISIL AAA |
2.68 |
|
Small Industries Dev Bank of India |
CRISIL AAA |
1.98 |
|
Power Finance Corporation Limited |
CRISIL AAA |
1.97 |
|
REC Limited |
CRISIL AAA |
1.85 |
|
NTPC Limited |
CRISIL AAA |
0.66 |
|
HDB Financial Services Limited |
CRISIL AAA |
0.66 |
|
Nuclear Power Corporation Of India Limited |
CRISIL AAA |
0.54 |
|
National Housing Bank |
CRISIL AAA |
0.53 |
|
Indian Railway Finance Corporation Limited |
CRISIL AAA |
0.53 |
|
Government Bond |
4.03 |
||
7.06% GOI (MD 10/04/2028) |
SOVEREIGN |
4.03 |
|
Short Term Debt & Net Current Assets |
12.54 |
Top Ten Holdings
Value of Investment of 10,000 |
||||||
| Period | Fund Returns (%) |
Benchmark Returns (%) |
Additional Benchmark Returns (%) |
Fund () |
Benchmark () |
Additional Benchmark () |
Regular - Growth |
||||||
| Last 1 Year | 4.39% |
7.03% |
9.00% |
10,438 |
10,701 |
10,897 |
| Last 3 Years | 10.76% |
10.67% |
14.08% |
13,589 |
13,556 |
14,848 |
| Last 5 Years | 9.63% |
10.22% |
14.52% |
15,844 |
16,275 |
19,714 |
| Since Inception | 6.13% |
10.85% |
14.11% |
14,362 |
18,717 |
22,333 |
Direct - Growth |
||||||
| Last 1 Year | 6.23% |
7.03% |
9.00% |
10,621 |
10,701 |
10,897 |
| Last 3 Years | 12.78% |
10.67% |
14.08% |
14,344 |
13,556 |
14,848 |
| Last 5 Years | 11.76% |
10.22% |
14.52% |
17,444 |
16,275 |
19,714 |
| Since Inception | 8.22% |
10.85% |
14.11% |
16,176 |
18,717 |
22,333 |
Past performance may or may not be sustained in future and is not a guarantee of any future returns, and should not be used as a basis of comparison with other investments. In case, the start / end date of the concerned period is a non-business date (NBD), the NAV of the previous date is considered for computation of returns. Different Plans i.e. Regular Plan and Direct Plan under the scheme have different expense structure. Benchmark: Nifty 50 Hybrid Composite Debt 50:50 Index Additional Benchmark: Nifty 50 TRI. Fund Managers: Mr. Rajesh Bhatia (Managing since 15-Sep-23) and Mr. Rohan Korde (Managing since 04-Nov-24), Mr. Laukik Bagwe (Since 01-Feb-25) and Mr. Vasav Sahgal (Since 17-Feb-25) Inception date of the scheme (31-Dec-19). Face Value per unit: Rs. 10. ITI Balanced Advantage Fund NAV as on January 30, 2026: Rs. 14.3624 (Regular Growth Option), Rs. 16.1758 (Direct Growth Option)
| Period | Amount Invested |
Fund Returns (%) |
Benchmark Returns (%) |
Additional Benchmark Returns (%) |
Fund Value () |
Benchmark Value () |
Additional Benchmark Value () |
Regular - Growth |
|||||||
| Last 1 Year | 1,20,000 |
1.71% |
4.75% |
6.99% |
1,21,099 |
1,23,044 |
1,24,466 |
| Last 3 Year | 3,60,000 |
6.96% |
8.32% |
10.37% |
3,99,981 |
4,08,124 |
4,20,594 |
| Last 5 Year | 6,00,000 |
8.05% |
9.08% |
11.71% |
7,34,909 |
7,54,036 |
8,05,006 |
| Since Inception | 7,40,000 |
8.42% |
10.14% |
14.05% |
9,62,439 |
10,15,424 |
11,46,227 |
Direct - Growth |
|||||||
| Last 1 Year | 1,20,000 |
3.52% |
4.75% |
6.99% |
1,22,260 |
1,23,044 |
1,24,466 |
| Last 3 Year | 3,60,000 |
8.91% |
8.32% |
10.37% |
4,11,652 |
4,08,124 |
4,20,594 |
| Last 5 Year | 6,00,000 |
10.07% |
9.08% |
11.71% |
7,72,964 |
7,54,036 |
8,05,006 |
| Since Inception | 7,40,000 |
10.49% |
10.14% |
14.05% |
10,26,513 |
10,15,424 |
11,46,227 |
Past performance may or may not be sustained in future and is not a guarantee of any future returns, and should not be used as a basis of comparison with other investments. Different Plans i.e. Regular Plan and Direct Plan under the scheme have different expense structure. Benchmark: Nifty 50 Hybrid Composite Debt 50:50 IndexAdditional Benchmark: Nifty 50 TRI. Additional Benchmark: Nifty 50 Hybrid Composite Debt 50:50 Index. For SIP returns, monthly investment of Rs.10,000 invested on the 1st business day of every month has been considered. CAGR Returns (%) are computed after accounting for the cash flow by using the XIRR method (investment internal rate of return).
Disclaimer - Fund SIP Performance
The performance details provided herein are of Growth option under Direct and Regular Plans. The Fund(s) offer Systematic Investment Plan (SIP) facility. To illustrate the advantages of SIP investments, this is how your investments would have grown if you had invested say Rs. 10,000 systematically on the first Business Day of every month over a period of time in the Growth Option of respective scheme. The returns are calculated by XIRR approach assuming investment of 10,000/- on the 1st working day of every month. XIRR helps in calculating return on investments given an initial and final value and a series of cash inflows and outflows with correct allowance for the time impact of the transactions.
Record Date |
Plan(s) Option(s) |
Individuals/ HUF (IDCW) (Rs per unit) |
Others (IDCW) (Rs per unit) |
Cum-IDCW NAV (Rs per unit) |
| 05-12-2025 | Regular Plan - IDCW Option | 0.1 | 0.1 | 12.6127 |
| 05-12-2025 | Direct Plan - IDCW Option | 0.1 | 0.1 | 14.3816 |
Pursuant to payment of IDCW, the NAV of the IDCW Option(s) of the Scheme/Plan(s) falls to the extent of payout and statutory levy, if any. Past performance may or may not be sustained in future and should not be used as a basis for comparison with other investments. For complete list of IDCW, visit www.itiamc.com.
THIS PRODUCT IS SUITABLE FOR INVESTORS WHO ARE SEEKING^
- Capital appreciation while generating income over medium to long term
- Dynamic Asset allocation between equity, equity related Instruments and fixed income instruments so as to provide with long term capital appreciation
^Investors should consult their financial advisers if in doubt about whether the product is suitable for them.

Face Value per Unit: Rs. 10 unless other wise specified; Data is as of January 31, 2026 unless other wise specified.
Mutual Fund investments are subject to market risks, read all scheme related documents carefully