| CATEGORY OF SCHEME | Flexi cap Fund |
| INVESTMENT OBJECTIVE | The investment objective of the scheme is to generate long-term capital appreciation from a diversified portfolio that dynamically invests in equity and equity-related securities of companies across various market capitalisation. However, there can be no assurance that the investment objective of the scheme would be achieved. |
| Inception Date (Date of Allotment): | 17th Feb 2023 |
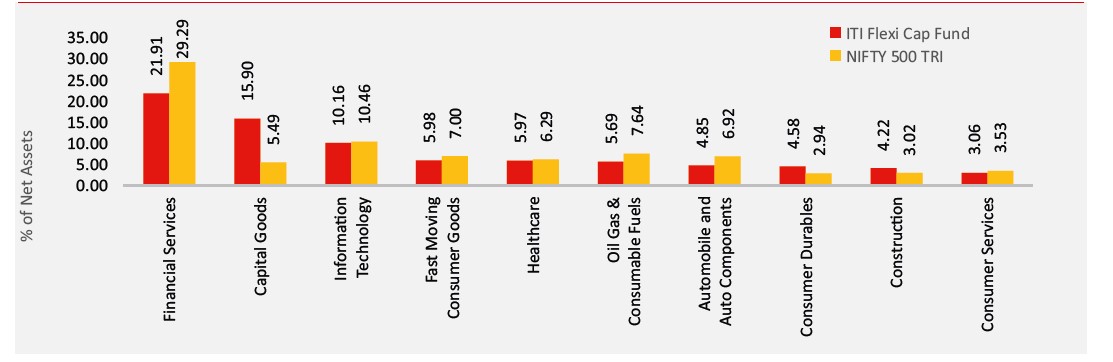
| Benchmark: | Nifty 500 Total Return Index |
| Minimum Application Amount: | Rs. 5,000/- and in
multiples of Rs. 1/- thereafter |
| Load Structure: | Entry Load: Not Applicable Exit Load: · 1% if redeemed or switched out on or before completion of 12 months from the date of allotment of units; · Nil, if redeemed or switched out after completion of 12 months from the date of allotment of units. |
| Total Expense Ratio (TER): | Including Additional Expenses and Goods and Service Tax on Management Fees Regular Plan: 1.97% Direct Plan: 0.15% |
| Fund Manager | Mr. Dhimant Shah (Since 17-Feb-2023) |
| AUM (in Rs. Cr): | 1,200.60 |
| AAUM (in Rs. Cr): | 1,235.40 |
| % of top 5 holdings: | 18.17% |
| % of top 10 holdings: | 29.02% |
| No of scrips: | 77 |
| Standard Deviation^: | NA |
| Beta^: | NA |
| Sharpe Ratio^*: | NA |
| Average P/B | 7.24 |
| Average P/E | 28.05 |
| Portfolio Beta | NA |
| Portfolio Turnover Ratio | 0.95 |
^Scheme has not completed 3 years hence NA
* Risk free rate: 7.15 (Source: FIMMDA MIBOR) |
|
Regular Plan
(in Rs.) |
Direct Plan
(in Rs.) |
|
| Growth: | 16.3034 |
16.8940 |
| IDCW: | 16.3034 |
16.8940 |
Name of the Instrument |
% to
NAV |
% to NAV
Derivatives |
|
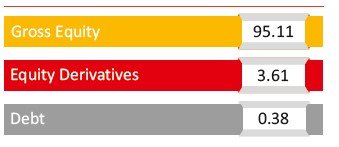
Equity & Equity Related Total |
95.11 |
3.61 |
|
Automobile and Auto Components |
4.85 |
||
FIEM Industries Limited |
1.21 |
||
TVS Motor Company Limited |
1.04 |
||
Craftsman Automation Limited |
0.98 |
||
Maruti Suzuki India Limited |
0.97 |
||
ZF Commercial Vehicle Control Systems India Limited |
0.65 |
||
Capital Goods |
15.90 |
||
PTC Industries Limited |
1.17 |
||
Polycab India Limited |
1.12 |
||
Syrma SGS Technology Limited |
1.09 |
||
Transrail Lighting Limited |
1.08 |
||
Inox Wind Limited |
1.08 |
||
Siemens Limited |
1.03 |
||
Kirloskar Oil Engines Limited |
1.02 |
||
Jyoti CNC Automation Ltd |
1.01 |
||
Kirloskar Pneumatic Company Limited |
1.00 |
||
Apar Industries Limited |
1.00 |
||
Bharat Electronics Limited |
0.97 |
||
Usha Martin Limited |
0.95 |
||
Finolex Cables Limited |
0.95 |
||
AIA Engineering Limited |
0.82 |
||
Vesuvius India Limited |
0.81 |
||
Premier Energies Limited |
0.81 |
||
Chemicals |
2.28 |
||
Vishnu Chemicals Limited |
1.22 |
||
Linde India Limited |
1.06 |
||
Construction |
4.22 |
||
Larsen & Toubro Limited |
2.32 |
||
ITD Cementation India Limited |
1.08 |
||
Techno Electric & Engineering Company Limited |
0.81 |
||
Construction Materials |
1.12 |
0.72 |
|
UltraTech Cement Limited |
1.07 |
||
Ambuja Cements Limited |
0.06 |
0.72 |
|
Consumer Durables |
4.58 |
||
Dixon Technologies (India) Limited |
1.44 |
||
PG Electroplast Limited |
1.35 |
||
Cera Sanitaryware Limited |
0.90 |
||
Senco Gold Limited |
0.89 |
||
Consumer Services |
3.06 |
||
The Indian Hotels Company Limited |
1.22 |
||
Zomato Limited |
1.05 |
||
Thomas Cook (India) Limited |
0.79 |
||
Fast Moving Consumer Goods |
5.98 |
||
ITC Limited |
2.74 |
||
Godfrey Phillips India Limited |
1.34 |
||
Hindustan Foods Limited |
0.96 |
||
Adani Wilmar Limited |
0.95 |
||
Financial Services |
19.69 |
2.22 |
|
HDFC Bank Limited |
4.18 |
||
ICICI Bank Limited |
3.27 |
0.99 |
|
Multi Commodity Exchange of India Limited |
1.90 |
||
State Bank of India |
1.74 |
||
Axis Bank Limited |
1.45 |
||
Power Finance Corporation Limited |
1.42 |
||
Cholamandalam Investment and Finance Company Ltd |
0.97 |
||
Max Financial Services Limited |
0.96 |
||
The Federal Bank Limited |
0.92 |
||
REC Limited |
0.87 |
||
Jio Financial Services Limited |
0.75 |
||
Kotak Mahindra Bank Limited |
0.73 |
0.63 |
|
IDBI Bank Limited |
0.53 |
||
One 97 Communications Limited |
0.60 |
||
Healthcare |
5.97 |
||
Wockhardt Limited |
1.45 |
||
Sun Pharmaceutical Industries Limited |
1.27 |
||
Concord Biotech Limited |
1.15 |
||
Divi's Laboratories Limited |
1.14 |
||
Mankind Pharma Limited |
0.96 |
||
Information Technology |
9.48 |
0.68 |
|
Infosys Limited |
2.60 |
0.68 |
|
Tata Consultancy Services Limited |
2.23 |
||
Oracle Financial Services Software Limited |
1.28 |
||
Zaggle Prepaid Ocean Services Limited |
1.24 |
||
Sagility India Limited |
1.09 |
||
Protean eGov Technologies Limited |
1.04 |
||
Metals & Mining |
2.09 |
||
Vedanta Limited |
1.17 |
||
Jindal Stainless Limited |
0.93 |
||
Oil Gas & Consumable Fuels |
5.69 |
||
Reliance Industries Limited |
3.71 |
||
Gulf Oil Lubricants India Limited |
1.00 |
||
Bharat Petroleum Corporation Limited |
0.98 |
||
Power |
2.17 |
||
NTPC Limited |
1.72 |
||
NTPC Green Energy Limited |
0.44 |
||
Realty |
1.93 |
||
Godrej Properties Limited |
0.97 |
||
Max Estates Limited |
0.96 |
||
Services |
0.82 |
||
Krystal Integrated Services Limited |
0.82 |
||
Telecommunication |
2.54 |
||
Bharti Airtel Limited |
2.54 |
||
Textiles |
0.89 |
||
Arvind Limited |
0.89 |
||
Utilities |
1.87 |
||
VA Tech Wabag Limited |
1.87 |
||
Mutual Fund Units |
0.38 |
||
ITI Banking & PSU Debt Fund -Direct Plan -Growth Option |
0.38 |
||
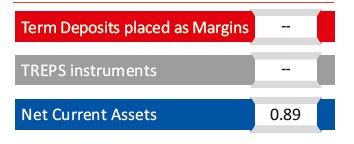
Short Term Debt & Net Current Assets |
0.89 |
Top Ten Holdings
| Period | Amount Invested |
Fund Value () |
Fund Returns (%) |
Benchmark Value () |
Benchmark Returns (%) |
Additional Benchmark Value () |
Regular - Growth |
||||||
| Last 1 Year | 10.34% |
10.03% |
9.55% |
11,037 |
11,006 |
10,958 |
| Since Inception | 28.39% |
21.55% |
16.14% |
16,303 |
14,650 |
13,401 |
Direct - Growth |
||||||
| Last 1 Year | 12.21% |
10.03% |
9.55% |
11,224 |
11,006 |
10,958 |
| Since Inception | 30.74% |
21.55% |
16.14% |
16,894 |
14,650 |
13,401 |
Past performance may or may not be sustained in future and is not a guarantee of any future returns, and should not be used as a basis of comparison with other investments. Different Plans i.e. Regular Plan and Direct Plan under the scheme have different expense structure. Benchmark: Nifty 500 TRI Additional Benchmark: Nifty 50 TRI. Fund Managers: Mr. Dhimant Shah (Managing since 17-Feb-2023) and Mr. Rohan Korde (Managing since 17-Feb-2023). Inception date of the scheme (17-Feb-23). Face Value per unit: Rs. 10.Since the scheme is in existence for more than 1 years but less than 3 years hence performance data for 3 & 5 years and more are not provided.
ITI Flexi Cap Fund NAV as on January 31, 2025: Rs. 16.3034 (Regular Growth Option), Rs. 16.8940 (Direct Growth Option)
| Period | Amount Invested |
Fund Returns (%) |
Benchmark Returns (%) |
Additional Benchmark Returns (%) |
Fund Value () |
Benchmark Value () |
Additional Benchmark Value () |
Regular - Growth |
|||||||
| Last 1 Year |
1,20,000 |
-7.44% |
-3.04% |
0.02% |
1,15,114 |
1,18,021 |
1,20,014 |
| Since Inception |
2,40,000 |
17.64% |
15.12% |
12.33% |
2,85,444 |
2,78,777 |
2,71,481 |
Direct - Growth |
|||||||
| Last 1 Year |
1,20,000 |
-5.77% |
-3.04% |
0.02% |
1,16,221 |
1,18,021 |
1,20,014 |
| Since Inception |
2,40,000 |
19.86% |
15.12% |
12.33% |
2,91,354 |
2,78,777 |
2,71,481 |
Past performance may or may not be sustained in future and is not a guarantee of any future returns, and should not be used as a basis of comparison with other investments. Different Plans i.e. Regular Plan and Direct Plan under the scheme have different expense structure. Benchmark: Nifty Healthcare TRI Additional Benchmark: Nifty 50 TRI. For SIP returns, monthly investment of Rs.10,000 invested on the 1st business day of every month has been considered. CAGR Returns (%) are computed after accounting for the cash flow by using the XIRR method (investment internal rate of return).
THIS PRODUCT IS SUITABLE FOR INVESTORS WHO ARE SEEKING^
- Capital appreciation over long term
- Investments in a diversified portfolio consisting of equity and equity related instruments across market capitalization
^Investors should consult their financial advisers if in doubt about whether the product is suitable for them.
Face Value per Unit: Rs. 10 unless other wise specified; Data is as of January 31, 2025 unless other wise specified.
Mutual Fund investments are subject to market risks, read all scheme related documents carefully