| CATEGORY OF SCHEME | Mid Cap Fund |
| INVESTMENT OBJECTIVE | The investment objective of the Scheme is to seek to generate long term capital appreciation by predominantly investing in equity and equity related securities of Mid Cap stocks. However, there can be no assurance that the investment objective of the scheme would be achieved. |
| Inception Date (Date of Allotment): | 05-Mar-2021 |
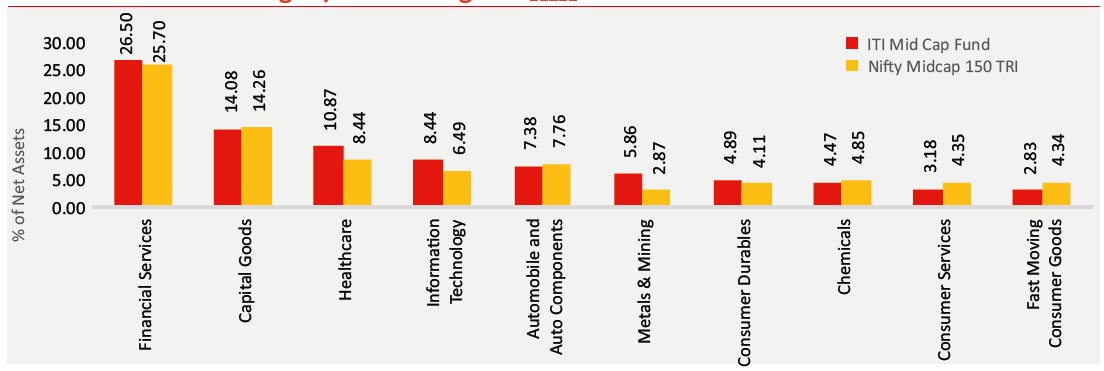
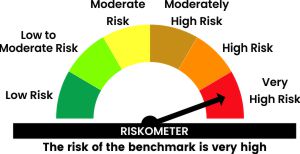
| Benchmark: | Nifty Midcap 150 TRI |
| Minimum Application Amount: | Rs.5,000/- and in multiples of Rs. 1/- thereafter |
| Load Structure: | Entry Load: Nil Exit Load: If redeemed/Switched out on or before 3 Months from the date of allotment; Exit Load is 0.50% Exit Load after completion of 3 months - NIL |
| Total Expense Ratio (TER): | Including Additional Expenses and Goods and Service
Tax on Management Fees |
| Fund Manager | Mr. Rohan Korde (Since 29 April 2022) Total Experience: 17 years Mr. Dhimant Shah (Since 01-Oct-2022) Total Experience: 26 years |
| AUM (in Rs. Cr): | 1,290.01 |
| AAUM (in Rs. Cr): | 1,273.47 |
| % of top 5 holdings: | 10.98% |
| % of top 10 holdings: | 20.02% |
| No. of scrips: | 81 |
| Standard Deviation^: | 16.25% |
| Beta^: | 1.00 |
| Sharpe Ratio^*: | 0.96 |
| Average P/B | 10.53 |
| Average P/E | 38.09 |
| Portfolio Turnover Ratio | 1.42 |
^Computed for the 3-yr period ended ended October 31, 2025. Based on monthly return. * Risk free rate: 5.69 (Source: FIMMDA MIBOR) |
|
Regular Plan
(in Rs.) |
Direct Plan
(in Rs.) |
|
| Growth: | 21.6769 |
23.7839 |
| IDCW: | 20.7124 |
22.7916 |
Value of Investment of 10,000 |
||||||
| Period | Fund Returns (%) |
Benchmark Returns (%) |
Additional Benchmark Returns (%) |
Fund () |
Benchmark () |
Additional Benchmark () |
Regular - Growth |
||||||
| Last 1 Year | 2.41% |
6.20% |
7.59% |
10,241 |
10,620 |
10,759 |
| Last 3 Years | 22.96% |
23.61% |
13.90% |
18,601 |
18,899 |
14,781 |
| Since Inception | 18.06% |
21.78% |
13.76% |
21,677 |
25,054 |
18,233 |
Direct - Growth |
||||||
| Last 1 Year | 4.17% |
6.20% |
7.59% |
10,417 |
10,620 |
10,759 |
| Last 3 Years | 25.21% |
23.61% |
13.90% |
19,640 |
18,899 |
14,781 |
| Since Inception | 20.43% |
21.78% |
13.76% |
23,784 |
25,054 |
18,233 |
Past performance may or may not be sustained in future and is not a guarantee of any future returns, and should not be used as a basis of comparison with other investments. The performance data for 5 years period has not been provided, since scheme is in existence for less than 5 years. In case, the start / end date of the concerned period is a non-business date (NBD), the NAV of the previous date is considered for computation of returns. Different Plans i.e. Regular Plan and Direct Plan under the scheme have different expense structure. Benchmark: Nifty Midcap 150 TRI Additional Benchmark: Nifty 50 TRI. Fund Managers: Mr. Rohan Korde (Managing since 29-April-2022) and Mr. Dhimant Shah (Managing since 01-October-2022). Inception date of the scheme (05-Mar-2021). Face Value per unit: Rs. 10. ITI Mid Cap Fund NAV as on October 31, 2025: Rs. 21.6769 (Regular Growth Option), Rs. 23.7839 (Direct Growth Option)
| Period | Amount Invested |
Fund Returns (%) |
Benchmark Returns (%) |
Additional Benchmark Returns (%) |
Fund Value () |
Benchmark Value () |
Additional Benchmark Value () |
Regular - Growth |
|||||||
| Last 1 Year | 1,20,000 |
13.44% |
15.92% |
14.55% |
1,28,515 |
1,30,050 |
1,29,199 |
| Last 3 Years | 3,60,000 |
20.04% |
20.47% |
13.57% |
4,82,957 |
4,85,832 |
4,40,594 |
| Since Inception | 5,60,000 |
19.47% |
21.04% |
13.47% |
8,79,114 |
9,10,597 |
7,66,877 |
Direct - Growth |
|||||||
| Last 1 Year | 1,20,000 |
15.29% |
15.92% |
14.55% |
1,29,658 |
1,30,050 |
1,29,199 |
| Last 3 Years | 3,60,000 |
22.24% |
20.47% |
13.57% |
4,97,914 |
4,85,832 |
4,40,594 |
| Since Inception | 5,60,000 |
21.72% |
21.04% |
13.47% |
9,24,770 |
9,10,597 |
7,66,877 |
Past performance may or may not be sustained in future and is not a guarantee of any future returns, and should not be used as a basis of comparison with other investments. Different Plans i.e. Regular Plan and Direct Plan under the scheme have different expense structure. Benchmark: Nifty Midcap 150 TRI Additional Benchmark: Nifty 50 TRI. For SIP returns, monthly investment of Rs.10,000 invested on the 1st business day of every month has been considered. CAGR Returns (%) are computed after accounting for the cash flow by using the XIRR method (investment internal rate of return).
Disclaimer - Fund SIP Performance
The performance details provided herein are of Growth option under Direct and Regular Plans. The Fund(s) offer Systematic Investment Plan (SIP) facility. To illustrate the advantages of SIP investments, this is how your investments would have grown if you had invested say Rs. 10,000 systematically on the first Business Day of every month over a period of time in the Growth Option of respective scheme. The returns are calculated by XIRR approach assuming investment of 10,000/- on the 1st working day of every month. XIRR helps in calculating return on investments given an initial and final value and a series of cash inflows and outflows with correct allowance for the time impact of the transactions.
Name of the Instrument |
% to
NAV |
% to NAV
Derivatives |
|
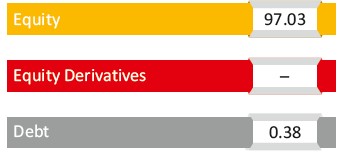
Equity & Equity Related Total |
97.03 |
||
Automobile and Auto Components |
7.36 |
||
TVS Motor Company Limited |
1.73 |
||
Tube Investments of India Limited |
1.43 |
||
UNO Minda Limited |
1.11 |
||
ZF Commercial Vehicle Control Systems India Limited |
1.07 |
||
Schaeffler India Limited |
1.03 |
||
Hero MotoCorp Limited |
0.99 |
||
Capital Goods |
14.08 |
||
Escorts Kubota Limited |
1.90 |
||
Cummins India Limited |
1.84 |
||
GE Vernova T&D India Limited |
1.52 |
||
PTC Industries Limited |
1.41 |
||
Suzlon Energy Limited |
1.30 |
||
Ashok Leyland Limited |
1.10 |
||
Shakti Pumps (India) Limited |
1.09 |
||
Mazagon Dock Shipbuilders Limited |
1.02 |
||
Polycab India Limited |
1.00 |
||
Supreme Industries Limited |
1.00 |
||
Jyoti CNC Automation Ltd |
0.91 |
||
Chemicals |
4.47 |
||
Solar Industries India Limited |
1.83 |
||
SRF Limited |
1.73 |
||
Navin Fluorine International Limited |
0.90 |
||
Construction |
2.74 |
||
KEC International Limited |
1.22 |
||
Vikran Engineering Limited |
1.00 |
||
M&B Engineering Limited |
0.52 |
||
Construction Materials |
1.29 |
||
JK Cement Limited |
1.29 |
||
Consumer Durables |
4.89 |
||
Blue Star Limited |
1.17 |
||
Midwest Limited |
1.07 |
||
PG Electroplast Limited |
0.98 |
||
Dixon Technologies (India) Limited |
0.91 |
||
LG Electronics India Ltd |
0.75 |
||
Consumer Services |
3.18 |
||
Vishal Mega Mart Limited |
1.29 |
||
Swiggy Limited |
0.99 |
||
FSN E-Commerce Ventures Limited |
0.90 |
||
Fast Moving Consumer Goods |
2.83 |
||
Marico Limited |
1.16 |
||
Colgate Palmolive (India) Limited |
0.90 |
||
Radico Khaitan Limited |
0.77 |
||
Financial Services |
26.50 |
||
The Federal Bank Limited |
2.41 |
||
Housing & Urban Development Corporation Limited |
1.83 |
||
PB Fintech Limited |
1.79 |
||
Sundaram Finance Limited |
1.65 |
||
One 97 Communications Limited |
1.53 |
||
Mahindra & Mahindra Financial Services Limited |
1.53 |
||
IDBI Bank Limited |
1.50 |
||
Indian Bank |
1.44 |
||
Nippon Life India Asset Management Limited |
1.21 |
||
Motilal Oswal Financial Services Limited |
1.19 |
||
HDB Financial Services Limited |
1.16 |
||
Shriram Finance Limited |
1.07 |
||
ICICI Lombard General Insurance Company Limited |
1.04 |
||
Canara Bank |
1.03 |
||
HDFC Asset Management Company Limited |
1.00 |
||
BSE Limited |
0.99 |
||
Aditya Birla Capital Limited |
0.90 |
||
L&T Finance Limited |
0.89 |
||
CSB Bank Limited |
0.83 |
||
Multi Commodity Exchange of India Limited |
0.77 |
||
Aptus Value Housing Finance India Limited |
0.75 |
||
Healthcare |
10.87 |
||
Fortis Healthcare Limited |
2.13 |
||
Max Healthcare Institute Limited |
1.36 |
||
Alkem Laboratories Limited |
1.22 |
||
Wockhardt Limited |
1.21 |
||
Sai Life Sciences Limited |
1.10 |
||
Aurobindo Pharma Limited |
1.04 |
||
Biocon Limited |
1.00 |
||
Abbott India Limited |
0.95 |
||
GlaxoSmithKline Pharmaceuticals Limited |
0.86 |
||
Information Technology |
8.44 |
||
Persistent Systems Limited |
2.42 |
||
Coforge Limited |
2.11 |
||
Oracle Financial Services Software Limited |
1.11 |
||
Hexaware Technologies Limited |
1.01 |
||
L&T Technology Services Limited |
0.95 |
||
Netweb Technologies India Limited |
0.84 |
||
Metals & Mining |
5.86 |
||
Lloyds Metals And Energy Limited |
1.47 |
||
National Aluminium Company Limited |
1.01 |
||
Hindustan Zinc Limited |
1.00 |
||
Hindustan Copper Limited |
0.90 |
||
Jain Resource Recycling Limited |
0.78 |
||
Vedanta Limited |
0.71 |
||
Oil Gas & Consumable Fuels |
0.80 |
||
Aegis Vopak Terminals Limited |
0.80 |
||
Power |
1.13 |
||
NTPC Limited |
1.13 |
||
Telecommunication |
1.62 |
||
Bharti Hexacom Limited |
1.62 |
||
Textiles |
0.98 |
||
Page Industries Limited |
0.98 |
|
|
Preference Shares |
0.02 |
||
TVS Motor Company Limited |
0.02 |
||
Mutual Fund Units |
0.38 |
||
ITI Banking & PSU Debt Fund -Direct Plan -Growth Option |
0.38 |
||
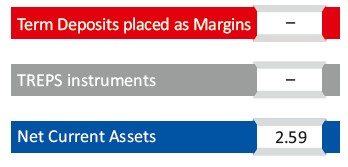
Short Term Debt & Net Current Assets |
2.57 |
|
Top Ten Holdings
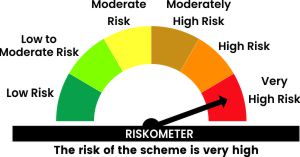
THIS PRODUCT IS SUITABLE FOR INVESTORS WHO ARE SEEKING^
- Capital appreciation over long term
- Investment in a diversified portfolio predominantly consisting of equity and equity related instruments of mid cap companies
^Investors should consult their financial advisers if in doubt about whether the product is suitable for them.
Face Value per Unit: Rs. 10 unless other wise specified; Data is as of October 31, 2025 unless other wise specified.
Mutual Fund investments are subject to market risks, read all scheme related documents carefully