| CATEGORY OF SCHEME | Liquid Fund |
| INVESTMENT OBJECTIVE | The investment objective of the Scheme is to provide reasonable returns, commensurate with low risk while providing a high level of liquidity, through a portfolio of money market and debt securities. However, there can be no assurance that the investment objective of the scheme will be realised. |
| Inception Date (Date of Allotment): | 24-Apr-19 |
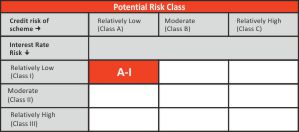
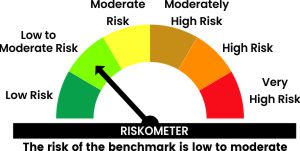
| Benchmark: | CRISIL Liquid Debt A-I Index |
| Minimum Application Amount: | Rs.5,000/- and in multiples of Rs. 1/- thereafter |
| Load Structure: | Entry Load: Nil Exit Load: Investor exit upon |
| subscription Up to Day 1 Day 2 Day 3 Day 4 Day 5 Day 6 Day 7 onwards |
Exit Load % 0.0070% 0.0065% 0.0060% 0.0055% 0.0050% 0.0045% 0.0000% |
| Total Expense Ratio (TER): | Including Additional Expenses and Goods and Service
Tax on Management Fees |
| Fund Manager* | Mr. Laukik Bagwe (Since 01-Feb-25) Total experience: 25 years |
| AUM (in Rs. Cr): | 48.22 |
| AAUM (in Rs. Cr): | 48.74 |
| Average Maturity: | 54 Days |
| Macaulay Duration: | 54 Days |
| Modified Duration: | 54 Days |
| Yield To Maturity (Regular & Direct) Plans : |
7.04% |
Regular Plan
(in Rs.) |
Direct Plan
(in Rs.) |
|
Growth |
1,338.2303 |
1,349.0848 |
Daily IDCW |
1,001.0000 |
1,001.0000 |
Weekly IDCW |
1,002.7254 |
1,002.7581 |
Fortnightly IDCW |
1,002.4619 |
NA |
Monthly IDCW |
1,001.9231 |
1,002.4839 |
Annual IDCW |
1,345.0973 |
1,350.6040 |
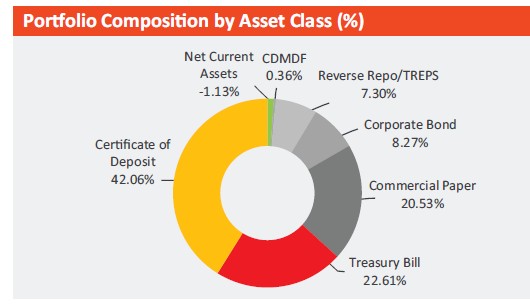
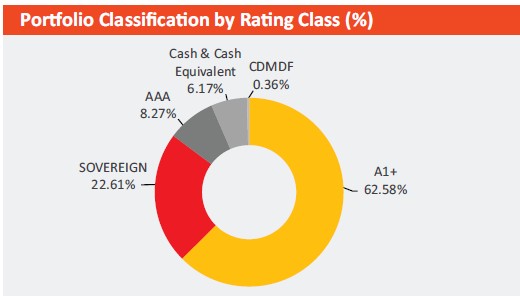
| Name of Instrument | Ratings |
Market Value (Rs. Lakhs) |
% to NAV |
Debt Instrument |
|||
Certificate of Deposit |
|||
Punjab National Bank |
CRISIL A1+ |
446.23 |
9.25 |
Canara Bank |
CRISIL A1+ |
445.17 |
9.23 |
HDFC Bank Limited |
CRISIL A1+ |
444.71 |
9.22 |
Bank of Baroda |
FITCH A1+ |
394.78 |
8.19 |
Indian Bank |
CRISIL A1+ |
297.03 |
6.16 |
Commercial Paper |
|||
ICICI Securities Limited |
CRISIL A1+ |
494.91 |
10.26 |
Bajaj Finance Limited |
CRISIL A1+ |
494.85 |
10.26 |
Corporate Bond |
|||
LIC Housing Finance Limited |
CRISIL AAA |
398.85 |
8.27 |
Corporate Debt Market Development Fund |
|||
Corporate Debt Market Development Fund Class A2 |
17.31 |
0.36 |
|
Treasury Bill |
|||
91 Days Tbill (MD 15/05/2025) |
SOVEREIGN |
496.20 |
10.29 |
91 Days Tbill (MD 12/06/2025) |
SOVEREIGN |
296.25 |
6.14 |
91 Days Tbill (MD 24/04/2025) |
SOVEREIGN |
199.20 |
4.13 |
364 Days Tbill (MD 19/06/2025) |
SOVEREIGN |
98.65 |
2.05 |
Reverse Repo/TREPS |
|||
Clearing Corporation of India Ltd |
NA |
351.93 |
7.30 |
Net Current Assets |
NA |
-54.31 |
-1.13 |
Total Net Assets |
100.00 |
Value of Investment of 10,000 |
||||||
| Period | Fund Returns (%) |
Benchmark Returns (%) |
Additional Benchmark Returns (%) |
Fund () |
Benchmark () |
Additional Benchmark () |
Regular - Growth |
||||||
Last 7 days |
10.16% |
9.37% |
7.46% |
10,019 |
10,018 |
10,014 |
Last 15 days |
8.60% |
8.36% |
8.23% |
10,035 |
10,034 |
10,034 |
| Last 30 days | 7.38% |
7.43% |
7.02% |
10,063 |
10,063 |
10,060 |
| Last 3 months | 6.96% |
7.18% |
7.17% |
10,172 |
10,177 |
10,177 |
Last 6 months |
6.90% |
7.08% |
6.84% |
10,344 |
10,353 |
10,341 |
Last 1 Year |
6.97% |
7.24% |
7.49% |
10,697 |
10,724 |
10,749 |
Last 3 Years |
6.38% |
6.75% |
6.39% |
12,040 |
12,168 |
12,043 |
Last 5 Years |
5.01% |
5.51% |
5.51% |
12,768 |
13,075 |
13,079 |
Since Inception |
5.03% |
5.59% |
5.84% |
13,382 |
13,811 |
14,012 |
Direct - Growth |
||||||
Last 7 days |
10.32% |
9.37% |
7.46% |
10,020 |
10,018 |
10,014 |
Last 15 days |
8.76% |
8.36% |
8.23% |
10,036 |
10,034 |
10,034 |
| Last 30 days | 7.54% |
7.43% |
7.02% |
10,064 |
10,063 |
10,060 |
| Last 3 months | 7.12% |
7.18% |
7.17% |
10,176 |
10,177 |
10,177 |
Last 6 months |
7.07% |
7.08% |
6.84% |
10,352 |
10,353 |
10,341 |
Last 1 Year |
7.14% |
7.24% |
7.49% |
10,714 |
10,724 |
10,749 |
Last 3 Years |
6.55% |
6.75% |
6.39% |
12,097 |
12,168 |
12,043 |
Last 5 Years |
5.15% |
5.51% |
5.51% |
12,858 |
13,075 |
13,079 |
Since Inception |
5.17% |
5.59% |
5.84% |
13,491 |
13,811 |
14,012 |
Past performance may or may not be sustained in future and is not a guarantee of any future returns, and should not be used as a basis of comparison with other investments. The performance data for 5 years period has not been provided, since scheme is in existence for less than 5 years. In case, the start / end date of the concerned period is a non-business date (NBD), the NAV of the previous date is considered for computation of returns. Different Plans i.e. Regular Plan and Direct Plan under the scheme have different expense structure. Benchmark: CRISIL Liquid Debt A-I Index Additional Benchmark: CRISIL 1 Year T-Bill Index. Fund Manager: Mr. Mr. Laukik Bagwe (Since 01-Feb-25). Returns less than 1 year period are simple annualized and greater than 1 year are compounded annualized. Inception date of the scheme (24-Apr-19). Face Value per unit: Rs. 1000. ITI Liquid Fund NAV as on March 31, 2025: Rs. 1338.2303 (Regular Growth Option), Rs. 1349.0848 (Direct Growth Option)
Record Date |
Plan(s) Option(s) |
Individuals/ HUF (IDCW) (Rs per unit) |
Others (IDCW) (Rs per unit) |
Cum-IDCW NAV (Rs per unit) |
| 27-01-2025 | Regular Plan - Monthly IDCW Option | 0.1538 |
0.1538 |
1001.1538 |
| 27-01-2025 | Direct Plan - Monthly IDCW Option | 6.3121 |
6.3121 |
1007.3121 |
| 25-02-2025 | Regular Plan - Monthly IDCW Option | 3.2308 |
3.2308 |
1004.2308 |
| 25-02-2025 | Direct Plan - Monthly IDCW Option | 5.5538 |
5.5538 |
1006.5538 |
| 25-03-2025 | Regular Plan - Monthly IDCW Option | 3.2308 |
3.2308 |
1004.2308 |
| 25-03-2025 | Direct Plan - Monthly IDCW Option | 5.2445 |
5.2445 |
1006.2445 |
Pursuant to payment of IDCW, the NAV of the IDCW Option(s) of the Scheme/Plan(s) falls to the extent of payout and statutory levy, if any. Past performance may or may not be sustained in future and should not be used as a basis for comparison with other investments. For complete list of IDCW, visit www.itiamc.com.
THIS PRODUCT IS SUITABLE FOR INVESTORS WHO ARE SEEKING^
- Regular income over short term.
- Investment in money market and debt instruments.
^Investors should consult their financial advisers if in doubt about whether the product is suitable for them.

Face Value per Unit: Rs. 1000 unless otherwise specified
Data is as of March 31, 2025 unless otherwise specified.
Mutual Fund investments are subject to market risks, read all scheme related documents carefully