Fund Performance data as on April 30, 2026
Value of Investment of 10,000 |
||||||
| Period | Fund Returns (%) |
Benchmark Returns (%) |
Additional Benchmark Returns (%) |
Fund () |
Benchmark () |
Additional Benchmark () |
Regular - Growth |
||||||
| Last 1 Year | -0.22% | 0.63% | -0.28% | 9,978 | 10,063 | 9,972 |
| Last 3 Years | 9.19% | 8.78% | 11.18% | 13,027 | 12,881 | 13,753 |
| Last 5 Years | 8.12% | 8.76% | 11.69% | 14,781 | 15,221 | 17,382 |
| Since Inception | 5.40% | 9.95% | 12.58% | 13,952 | 18,237 | 21,183 |
Direct - Growth |
||||||
| Last 1 Year | 1.52% | 0.63% | -0.28% | 10,152 | 10,063 | 9,972 |
| Last 3 Years | 11.15% | 8.78% | 11.18% | 13,746 | 12,881 | 13,753 |
| Last 5 Years | 10.18% | 8.76% | 11.69% | 16,242 | 15,221 | 17,382 |
| Since Inception | 7.47% | 9.95% | 12.58% | 15,780 | 18,237 | 21,183 |
Past performance may or may not be sustained in future and is not a guarantee of any future returns, and should not be used as a basis of comparison with other investments. In case, the start / end date of the concerned period is a non-business date (NBD), the NAV of the previous date is considered for computation of returns. Different Plans i.e. Regular Plan and Direct Plan under the scheme have different expense structure. Benchmark: Nifty 50 Hybrid Composite Debt 50:50 Index Additional Benchmark: Nifty 50 TRI. Fund Managers: Mr. Rajesh Bhatia (Managing since 15-Sep-23), Mr. Laukik Bagwe (Managing since 01-Feb-25) and Mr. Vasav Sahgal (Managing Since 17-Feb-25) . Inception date of the scheme (31-Dec-19). Face Value per unit: Rs. 10 ITI Balanced Advantage Fund NAV as on April 30, 2026: Rs. 13.9520 (Regular Growth Option), Rs. 15.7802 (Direct Growth Option)
Value of Investment of 10,000 |
||||||
| Period | Fund Returns (%) |
Benchmark Returns (%) |
Additional Benchmark Returns (%) |
Fund () |
Benchmark () |
Additional Benchmark () |
Regular - Growth |
||||||
Last 1 Year |
10.76% | 5.95% | -0.28% | 11,076 | 10,595 | 9,972 |
Last 3 Years |
19.31% | 17.82% | 11.18% | 17,008 | 16,379 | 13,753 |
Last 5 Years |
13.17% | 16.01% | 11.69% | 18,568 | 21,019 | 17,382 |
Since Inception |
13.43% | 17.17% | 12.94% | 24,058 | 30,145 | 23,337 |
Direct - Growth |
||||||
Last 1 Year |
12.41% | 5.95% | -0.28% | 11,241 | 10,595 | 9,972 |
| Last 3 Years | 21.28% | 17.82% | 11.18% | 17,868 | 16,379 | 13,753 |
Last 5 Years |
15.26% | 16.01% | 11.69% | 20,354 | 21,019 | 17,382 |
Since Inception |
15.63% | 17.17% | 12.94% | 27,501 | 30,145 | 23,337 |
Past performance may or may not be sustained in future and is not a guarantee of any future returns, and should not be used as a basis of comparison with other investments. In case, the start / end date of the concerned period is a non-business date (NBD), the NAV of the previous date is considered for computation of returns. Different Plans i.e. Regular Plan and Direct Plan under the scheme have different expense structure. Benchmark: Nifty 500 Multicap 50:25:25 TRI Additional Benchmark: Nifty 50 TRI. Fund Managers: Mr. Dhimant Shah (Managing since 08-August-2022) Inception date of the scheme (15-May-19). Face Value per unit: Rs. 10. ITI Multi Cap Fund NAV as on April 30, 2026: Rs. 24.0583 (Regular Growth Option), Rs. 27.5014 (Direct Growth Option)
Value of Investment of 10,000 |
||||||
| Period | Fund Returns (%) |
Benchmark Returns (%) |
Additional Benchmark Returns (%) |
Fund () |
Benchmark () |
Additional Benchmark () |
Regular - Growth |
||||||
| Last 1 Year | 12.21% | 9.56% | -0.28% | 11,221 | 10,956 | 9,972 |
| Last 3 Years | 25.17% | 21.89% | 11.18% | 19,646 | 18,138 | 13,753 |
| Last 5 Years | 17.59% | 18.99% | 11.69% | 22,490 | 23,865 | 17,382 |
| Since Inception | 18.79% | 21.91% | 13.04% | 29,090 | 34,175 | 21,390 |
Direct - Growth |
||||||
| Last 1 Year | 13.87% | 9.56% | -0.28% | 11,387 | 10,956 | 9,972 |
| Last 3 Years | 27.19% | 21.89% | 11.18% | 20,615 | 18,138 | 13,753 |
| Last 5 Years | 19.71% | 18.99% | 11.69% | 24,595 | 23,865 | 17,382 |
| Since Inception | 21.03% | 21.91% | 13.04% | 32,663 | 34,175 | 21,390 |
Past performance may or may not be sustained in future and is not a guarantee of any future returns, and should not be used as a basis of comparison with other investments. In case, the start / end date of the concerned period is a non-business date (NBD), the NAV of the previous date is considered for computation of returns. Different Plans i.e. Regular Plan and Direct Plan under the scheme have different expense structure. Benchmark: Nifty Small Cap 250 TRI Additional Benchmark: Nifty 50 TRI. Fund Managers: Mr. Dhimant Shah (Managing since 08-August-2022) Inception date of the scheme (Since 17-Feb-20). Face Value per unit: Rs. 10. Since the scheme is in existence for more than 3 years but less than 5 years hence performance data for 5 years is not provided. ITI Small Cap Fund NAV as on April 30, 2026: Rs. 29.0896 (Regular Growth Option), Rs. 32.6631 (Direct Growth Option)
| Period | Amount Invested |
Fund Value () |
Fund Returns (%) |
Benchmark Value () |
Benchmark Returns (%) |
Additional Benchmark Value () |
Regular - Growth |
||||||
| Last 1 Year | 9.97% | 3.96% | -0.28% | 10,997 | 10,396 | 9,972 |
| Last 3 Year | 19.84% | 15.28% | 11.18% | 17,236 | 15,339 | 13,753 |
| Since Inception | 20.12% | 14.83% | 10.72% | 17,981 | 15,566 | 13,852 |
Direct - Growth |
||||||
| Last 1 Year | 11.63% | 3.96% | -0.28% | 11,163 | 10,396 | 9,972 |
| Last 3 Year | 21.88% | 15.28% | 11.18% | 18,135 | 15,339 | 13,753 |
| Since Inception | 22.20% | 14.83% | 10.72% | 18,997 | 15,566 | 13,852 |
Past performance may or may not be sustained in future and is not a guarantee of any future returns, and should not be used as a basis of comparison with other investments. The performance data for 3 years period has not been provided, since scheme is in existence for less than 3 years. In case, the start / end date of the concerned period is a non-business date (NBD), the NAV of the previous date is considered for computation of returns. Different Plans i.e. Regular Plan and Direct Plan under the scheme have different expense structure. Benchmark: Nifty 500 TRI Additional Benchmark: Nifty 50 TRI. Fund Managers: Mr. Dhimant Shah (Managing since 17-Feb-2023). Inception date of the scheme (17-Feb-23). Face Value per unit: Rs. 10. ITI Flexi Cap Fund NAV as on April 30, 2026: Rs. 17.9814 (Regular Growth Option), Rs. 18.9967 (Direct Growth Option)
| Period | Fund Returns (%) |
Benchmark Returns (%) |
Additional Benchmark Returns (%) |
Benchmark (Rs) |
Fund (Rs) |
Additional Benchmark Returns (Rs) |
Regular - Growth |
||||||
| Last 1 Year | 10.91% | 3.96% | -0.28% | 11,091 | 10,396 | 9,972 |
| Since Inception | 16.98% | 13.62% | 10.15% | 15,674 | 14,419 | 13,191 |
Direct - Growth |
||||||
| Last 1 Year | 12.96% | 3.96% | -0.28% | 11,296 | 10,396 | 9,972 |
| Since Inception | 19.17% | 13.62% | 10.15% | 16,530 | 14,419 | 13,191 |
Past performance may or may not be sustained in future and is not a guarantee of any future returns, and should not be used as a basis of comparison with other investments. The performance data for 3 years period has not been provided, since scheme is in existence for less than 3 years. In case, the start / end date of the concerned period is a non-business date (NBD), the NAV of the previous date is considered for computation of returns. Different Plans i.e. Regular Plan and Direct Plan under the scheme have different expense structure. Benchmark: Nifty 500 TRI Additional Benchmark: Nifty 50 TRI. Fund Managers: Mr. Dhimant Shah (Managing since 19-June-2023). Inception date of the scheme is (19-June-23). Face Value per unit: Rs. 10. ITI Focused Equity Fund NAV as on April 30, 2026: Rs. 15.6742 (Regular Growth Option), Rs. 16.5298 (Direct Growth Option)
Value of Investment of 10,000 |
||||||
| Period | Fund Returns (%) |
Benchmark Returns (%) |
Additional Benchmark Returns (%) |
Fund () |
Benchmark () |
Additional Benchmark () |
Regular - Growth |
||||||
| Last 1 Year | 11.39% | 11.40% | -0.28% | 11,139 | 11,140 | 9,972 |
| Last 3 Years | 23.61% | 23.25% | 11.18% | 18,920 | 18,756 | 13,753 |
| Last 5 Years | 16.78% | 20.06% | 11.69% | 21,727 | 24,959 | 17,382 |
| Since Inception | 16.27% | 19.51% | 10.89% | 21,758 | 25,066 | 17,043 |
Direct - Growth |
||||||
| Last 1 Year | 13.17% | 11.40% | -0.28% | 11,317 | 11,140 | 9,972 |
| Last 3 Years | 25.77% | 23.25% | 11.18% | 19,934 | 18,756 | 13,753 |
| Last 5 Years | 19.06% | 20.06% | 11.69% | 23,939 | 24,959 | 17,382 |
| Since Inception | 18.57% | 19.51% | 10.89% | 24,063 | 25,066 | 17,043 |
Past performance may or may not be sustained in future and is not a guarantee of any future returns, and should not be used as a basis of comparison with other investments. The performance data for 5 years period has not been provided, since scheme is in existence for less than 5 years. In case, the start / end date of the concerned period is a non-business date (NBD), the NAV of the previous date is considered for computation of returns. Different Plans i.e. Regular Plan and Direct Plan under the scheme have different expense structure. Benchmark: Nifty Midcap 150 TRI Additional Benchmark: Nifty 50 TRI. Fund Managers: Mr. Dhimant Shah (Managing since 01-October-2022). Inception date of the scheme (05-Mar-2021). Face Value per unit: Rs. 10.
Since the scheme is in existence for more than 3 years but less than 5 years hence performance data for 5 years is not provided.
ITI Mid Cap Fund NAV as on April 30, 2026: Rs. 21.7575 (Regular Growth Option), Rs. 24.0627 (Direct Growth Option)
| Period | Fund Returns (%) |
Benchmark Returns (%) |
Additional Benchmark Returns (%) |
Benchmark (Rs) |
Fund (Rs) |
Additional Benchmark Returns (Rs) |
Regular - Growth |
||||||
| Last 1 Year | 1.05% | 1.78% | -0.28% | 10,105 | 10,178 | 9,972 |
| Since Inception | 7.34% | 8.38% | 6.52% | 10,865 | 10,987 | 10,766 |
Direct - Growth |
||||||
| Last 1 Year | 2.85% | 1.78% | -0.28% | 10,285 | 10,178 | 9,972 |
| Since Inception | 9.28% | 8.38% | 6.52% | 11,093 | 10,987 | 10,766 |
Past performance may or may not be sustained in future and is not a guarantee of any future returns, and should not be used as a basis of comparison with other investments. Different Plans i.e. Regular Plan and Direct Plan under the scheme have different expense structure. Benchmark: Nifty India Consumption TRI # Additional Benchmark: Nifty 50 TRI. Fund Manager: Mr. Dhimant Shah (Managing Since 06-Mar-25). Inception date of the scheme (Feb-27-2025) Face Value per unit: Rs. 10. Since the scheme is in existence for more than 1 years but less than 3 years hence performance data for 3 & 5 years and more are not provided. ITI Bharat Consumption Fund NAV as on April 30, 2026: Rs. 10.8645 (Regular Growth Option), Rs. 11.0934 (Direct Growth Option)
Value of Investment of 10,000 |
||||||
| Period | Fund Returns (%) |
Benchmark Returns (%) |
Additional Benchmark Returns (%) |
Fund () |
Benchmark () |
Additional Benchmark () |
Regular - Growth |
||||||
| Last 1 Year | 9.12% | 3.96% | -0.28% | 10,912 | 10,396 | 9,972 |
| Last 3 Years | 16.97% | 15.28% | 11.18% | 16,026 | 15,339 | 13,753 |
| Since Inception | 11.20% | 12.22% | 10.15% | 16,790 | 17,553 | 16,030 |
Direct - Growth |
||||||
| Last 1 Year | 11.10% | 3.96% | -0.28% | 11,110 | 10,396 | 9,972 |
| Last 3 Years | 19.15% | 15.28% | 11.18% | 16,940 | 15,339 | 13,753 |
| Since Inception | 13.44% | 12.22% | 10.15% | 18,500 | 17,553 | 16,030 |
Past performance may or may not be sustained in future and is not a guarantee of any future returns, and should not be used as a basis of comparison with other investments. The performance data for 5 years period has not been provided, since scheme is in existence for less than 5 years. In case, the start / end date of the concerned period is a non-business date (NBD), the NAV of the previous date is considered for computation of returns. Different Plans i.e. Regular Plan and Direct Plan under the scheme have different expense structure. Benchmark: Nifty 500 TRI Additional Benchmark: Nifty 50 TRI. Fund Managers: Mr. Dhimant Shah (Managing since 01-December-2022). Inception date of the scheme (14-June-2021). Face Value per unit: Rs. 10. Since the scheme is in existence for more than 3 years but less than 5 years hence performance data for 5 years and more are not provided. ITI Value Fund NAV as on April 30, 2026: Rs. 16.7900 (Regular Growth Option), Rs. 18.4996 (Direct Growth Option)
Value of Investment of 10,000 |
||||||
| Period | Fund Returns (%) |
Benchmark Returns (%) |
Additional Benchmark Returns (%) |
Fund () |
Benchmark () |
Additional Benchmark () |
Regular - Growth |
||||||
| Last 1 Year | 0.32% | 6.78% | -0.28% | 10,032 | 10,678 | 9,972 |
| Last 3 Years | 19.48% | 23.71% | 11.18% | 17,083 | 18,964 | 13,753 |
| Since Inception | 10.95% | 13.73% | 7.74% | 15,921 | 17,787 | 13,960 |
Direct - Growth |
||||||
| Last 1 Year | 2.23% | 6.78% | -0.28% | 10,223 | 10,678 | 9,972 |
| Last 3 Years | 21.82% | 23.71% | 11.18% | 18,109 | 18,964 | 13,753 |
| Since Inception | 13.20% | 13.73% | 7.74% | 17,419 | 17,787 | 13,960 |
Past performance may or may not be sustained in future and is not a guarantee of any future returns, and should not be used as a basis of comparison with other investments. The performance data for 5 years period has not been provided, since scheme is in existence for less than 5 years. In case, the start / end date of the concerned period is a non-business date (NBD), the NAV of the previous date is considered for computation of returns. Different Plans i.e. Regular Plan and Direct Plan under the scheme have different expense structure. Benchmark: Nifty Healthcare TRI Additional Benchmark: Nifty 50 TRI. Fund Managers: Mr. Dhimant Shah (Managing since 01-December-22). Inception date of the scheme is (08-Nov-2021). Face Value per unit: Rs. 10. Since the scheme is in existence for more than 3 years but less than 5 years hence performance data for 5 years and more are not provided.
ITI Pharma & Healthcare Fund NAV as on April 30, 2026: Rs. 15.9207 (Regular Growth Option), Rs. 17.4188 (Direct Growth Option)
| Period | Fund Returns (%) |
Benchmark Returns (%) |
Additional Benchmark Returns (%) |
Fund (Rs) |
Benchmark (Rs) |
Additional Benchmark Returns (Rs) |
Regular - Growth |
||||||
| Last 1 Year | 0.35% | 1.32% | -0.28% | 10,035 | 10,132 | 9,972 |
| Last 3 Years | 11.51% | 12.80% | 11.18% | 13,877 | 14,367 | 13,753 |
| Last 5 Years | 9.91% | 12.20% | 11.69% | 16,047 | 17,787 | 17,382 |
| Since Inception | 10.24% | 12.77% | 12.24% | 16,851 | 19,027 | 18,548 |
Direct - Growth |
||||||
| Last 1 Year | 2.17% | 1.32% | -0.28% | 10,217 | 10,132 | 9,972 |
| Last 3 Years | 13.61% | 12.80% | 11.18% | 14,679 | 14,367 | 13,753 |
Last 5Years |
12.12% | 12.20% | 11.69% | 17,722 | 17,787 | 17,382 |
| Since Inception | 12.49% | 12.77% | 12.24% | 18,771 | 19,027 | 18,548 |
Past performance may or may not be sustained in future and is not a guarantee of any future returns, and should not be used as a basis of comparison with other investments. The performance data for 5 years period has not been provided, since scheme is in existence for less than 5 years. In case, the start / end date of the concerned period is a non-business date (NBD), the NAV of the previous date is considered for computation of returns. Different Plans i.e. Regular Plan and Direct Plan under the scheme have different expense structure. Benchmark: Nifty 100 TRI Additional Benchmark: Nifty 50 TRI. Fund Managers: Mr. Alok Ranjan (Managing Since 04-Nov-2024). Inception date of the scheme (24-Dec-20). Face Value per unit: Rs. 10.Since the scheme is in existence for more than 3 years but less than 5 years hence performance data for 5 years is not provided. ITI Large Cap Fund NAV as on April 30, 2026: Rs. 16.8505 (Regular Growth Option), Rs. 18.7711 (Direct Growth Option)
Value of Investment of 10,000 |
||||||
| Period | Fund Returns (%) |
Benchmark Returns (%) |
Additional Benchmark Returns (%) |
Fund () |
Benchmark () |
Additional Benchmark () |
Regular - Growth |
||||||
| Last 1 Year | 8.58% | 3.96% | -0.28% | 10,858 | 10,396 | 9,972 |
| Last 3 Years | 18.93% | 15.28% | 11.18% | 16,845 | 15,339 | 13,753 |
| Last 5 Years | 13.12% | 14.03% | 11.69% | 18,526 | 19,289 | 17,382 |
| Since Inception | 14.38% | 15.41% | 12.92% | 24,067 | 25,514 | 22,124 |
Direct - Growth |
||||||
| Last 1 Year | 10.59% | 3.96% | -0.28% | 11,059 | 10,396 | 9,972 |
| Last 3 Years | 21.09% | 15.28% | 11.18% | 17,785 | 15,339 | 13,753 |
| Last 5 Years | 15.30% | 14.03% | 11.69% | 20,385 | 19,289 | 17,382 |
| Since Inception | 16.66% | 15.41% | 12.92% | 27,388 | 25,514 | 22,124 |
(*ITI Long Term Equity Fund name has been changed to ITI ELSS Tax Saver Fund with effect from October 30, 2023.)
Past performance may or may not be sustained in future and is not a guarantee of any future returns, and should not be used as a basis of comparison with other investments. In case, the start / end date of the concerned period is a non-business date (NBD), the NAV of the previous date is considered for computation of returns. Different Plans i.e. Regular Plan and Direct Plan under the scheme have different expense structure. Benchmark: Nifty 500 TRI Additional Benchmark: Nifty 50 TRI. Fund Managers: Mr. Alok Ranjan (Managing since 04-Nov-2024) and Mr. Dhimant Shah (Managing since 01-Dec-22). Inception date of the scheme (18-Oct-19). Face Value per unit: Rs. 10. ITI ELSS Tax Saver Fund NAV as on April 30, 2026: Rs. 24.0673 (Regular Growth Option), Rs. 27.3883 (Direct Growth Option)
| Period | Fund Returns (%) |
Benchmark Returns (%) |
Additional Benchmark Returns (%) |
Benchmark (Rs) |
Fund (Rs) |
Additional Benchmark Returns (Rs) |
Regular - Growth |
||||||
| Last 1 Year | 3.90% | 6.29% | -0.28% | 10,390 | 10,629 | 9,972 |
| Since Inception | -3.90% | -0.21% | -1.36% | 9,372 | 9,965 | 9,779 |
Direct - Growth |
||||||
| Last 1 Year | 5.62% | 6.29% | -0.28% | 10,562 | 10,629 | 9,972 |
| Since Inception | -2.25% | -0.21% | -1.36% | 9,636 | 9,965 | 9,779 |
Past performance may or may not be sustained in future and is not a guarantee of any future returns, and should not be used as a basis of comparison with other investments. Different Plans i.e. Regular Plan and Direct Plan under the scheme have different expense structure. Benchmark: Nifty Large Midcap 250 TRI # Additional Benchmark: Nifty 50 TRI. Mr. Alok Ranjan (Managing Since 04-Nov-24). Face Value per unit: Rs. 10. Since the scheme is in existence for more than 1 years but less than 3 years hence performance data for 3 & 5 years and more are not provided. ITI Large & Mid Cap Fund NAV as on April 30, 2026: Rs. 9.3717 (Regular Growth Option), Rs. 9.6359 (Direct Growth Option)
Value of Investment of 10,000 |
||||||
| Period | Fund Returns (%) |
Benchmark Returns (%) |
Additional Benchmark Returns (%) |
Fund () |
Benchmark () |
Additional Benchmark () |
Regular - Growth |
||||||
| Last 1 Year | 5.53% | -0.77% | -0.28% | 10,553 | 9,923 | 9,972 |
| Last 3 Years | 12.29% | 11.30% | 11.18% | 14,173 | 13,798 | 13,753 |
| Since Inception | 10.29% | 9.92% | 9.50% | 15,385 | 15,160 | 14,907 |
Direct - Growth |
||||||
| Last 1 Year | 7.51% | -0.77% | -0.28% | 10,751 | 9,923 | 9,972 |
| Last 3 Years | 14.42% | 11.30% | 11.18% | 14,997 | 13,798 | 13,753 |
| Since Inception | 12.50% | 9.92% | 9.50% | 16,791 | 15,160 | 14,907 |
Past performance may or may not be sustained in future and is not a guarantee of any future returns, and should not be used as a basis of comparison with other investments. The performance data for 5 years period has not been provided, since scheme is in existence for less than 5 years. In case, the start / end date of the concerned period is a non-business date (NBD), the NAV of the previous date is considered for computation of returns. Different Plans i.e. Regular Plan and Direct Plan under the scheme have different expense structure. Benchmark: Nifty Financial Services TRI Additional Benchmark: Nifty 50 TRI. Fund Managers: Mr. Nilay Dalal (Managing since 05-May-23). Inception date of the scheme (06-Dec-21). Face Value per unit: Rs. 10. Since the scheme is in existence for more than 3 years but less than 5 years hence performance data for 5 years and more are not provided. ITI Banking and Financial Services Fund NAV as on April 30, 2026: Rs. 15.3847 (Regular Growth Option), Rs. 16.7905 (Direct Growth Option)
Value of Investment of 10,000 |
||||||
| Period | Fund Returns (%) |
Benchmark Returns (%) |
Additional Benchmark Returns (%) |
Fund () |
Benchmark () |
Additional Benchmark () |
Regular - Growth |
||||||
| Last 1 Year | 4.73% | 4.85% | 0.59% | 10,473 | 10,485 | 10,059 |
| Last 3 Years | 6.58% | 6.71% | 6.35% | 12,114 | 12,158 | 12,035 |
| Last 5 Years | 5.76% | 5.83% | 4.78% | 13,232 | 13,278 | 12,628 |
| Since Inception | 5.61% | 5.69% | 4.67% | 13,521 | 13,578 | 12,869 |
Direct - Growth |
||||||
| Last 1 Year | 5.30% | 4.85% | 0.59% | 10,530 | 10,485 | 10,059 |
| Last 3 Years | 7.17% | 6.71% | 6.35% | 12,316 | 12,158 | 12,035 |
| Last 5 Years | 6.34% | 5.83% | 4.78% | 13,601 | 13,278 | 12,628 |
| Since Inception | 6.20% | 5.69% | 4.67% | 13,938 | 13,578 | 12,869 |
Past performance may or may not be sustained in future and is not a guarantee of any future returns, and should not be used as a basis of comparison with other investments. The performance data for 5 years period has not been provided, since scheme is in existence for less than 5 years. In case, the start / end date of the concerned period is a non-business date (NBD), the NAV of the previous date is considered for computation of returns. Different Plans i.e. Regular Plan and Direct Plan under the scheme have different expense structure. Benchmark: CRISIL Banking and PSU Debt A-II Index Additional Benchmark: CRISIL 10 Year Gilt Index. Fund Manager: Mr. Laukik Bagwe from (Managing since 01-Feb-25). Inception date of the scheme (22-Oct-20). Face Value per unit: Rs. 10. Since the scheme is in existence for more than 3 years but less than 5 years hence performance data for 5 years is not provided. ITI Banking and PSU Debt Fund NAV as on April 30, 2026: Rs. 13.5211 (Regular Growth Option), Rs. 13.9381 (Direct Growth Option)
Value of Investment of 10,000 |
||||||
| Period | Fund Returns (%) |
Benchmark Returns (%) |
Additional Benchmark Returns (%) |
Fund () |
Benchmark () |
Additional Benchmark () |
Regular - Growth |
||||||
| Last 1 Year | 0.94% | 2.02% | 0.59% | 10,094 | 10,202 | 10,059 |
| Last 3 Years | 5.71% | 6.38% | 6.35% | 11,819 | 12,046 | 12,035 |
| Since Inception | 5.13% | 5.62% | 4.97% | 12,713 | 13,002 | 12,620 |
Direct - Growth |
||||||
| Last 1 Year | 2.00% | 2.02% | 0.59% | 10,200 | 10,202 | 10,059 |
| Last 3 Years | 6.82% | 6.38% | 6.35% | 12,197 | 12,046 | 12,035 |
| Since Inception | 6.25% | 5.62% | 4.97% | 13,375 | 13,002 | 12,620 |
Past performance may or may not be sustained in future and is not a guarantee of any future returns, and should not be used as a basis of comparison with other investments.The performance data for 5 years period has not been provided, since scheme is in existence for less than 5 years. In case, the start / end date of the concerned period is a non-business date (NBD), the NAV of the previous date is considered for computation of returns. Different Plans i.e. Regular Plan and Direct Plan under the scheme have different expense structure. Benchmark: CRISIL Dynamic Bond A-III Index Additional Benchmark: CRISIL 10 Year Gilt Index. Fund Manager: Mr. Laukik Bagwe from (Managing since 01-Feb-25). Inception date of the scheme (14-Jul-21). Face Value per unit: Rs. 10.Since the scheme is in existence for more than 3 years but less than 5 years hence performance data for 5 years and more are not provided. ITI Dynamic Bond Fund NAV as on April 30, 2026: Rs. 12.7129 (Regular Growth Option), Rs. 13.3746 (Direct Growth Option)
Value of Investment of 10,000 |
||||||
| Period | Fund Returns (%) |
Benchmark Returns (%) |
Additional Benchmark Returns (%) |
Fund () |
Benchmark () |
Additional Benchmark () |
Regular - Growth |
||||||
| Last 7 days | 4.76% | 5.07% | -0.12% | 10,009 | 10,010 | 10,000 |
| Last 15 days | 4.72% | 5.03% | 1.79% | 10,019 | 10,021 | 10,007 |
| Last 1 Month | 4.68% | 4.99% | 3.90% | 10,038 | 10,041 | 10,032 |
| Last 3 Months | 4.66% | 4.98% | 4.24% | 10,114 | 10,121 | 10,103 |
| Last 6 Months | 4.83% | 5.15% | 3.87% | 10,240 | 10,255 | 10,192 |
| Last 1 Year | 5.09% | 5.39% | 4.62% | 10,509 | 10,539 | 10,462 |
| Last 3 Years | 5.92% | 6.27% | 6.51% | 11,886 | 12,003 | 12,085 |
| Last 5 Years | 5.27% | 5.59% | 5.63% | 12,930 | 13,129 | 13,154 |
| Since Inception | 4.83% | 5.11% | 5.57% | 13,597 | 13,842 | 14,241 |
Direct - Growth |
||||||
| Last 7 days | 4.84% | 5.07% | -0.12% | 10,009 | 10,010 | 10,000 |
| Last 15 days | 4.80% | 5.03% | 1.79% | 10,020 | 10,021 | 10,007 |
| Last 1 Month | 4.76% | 4.99% | 3.90% | 10,039 | 10,041 | 10,032 |
| Last 3 Months | 4.76% | 4.98% | 4.24% | 10,116 | 10,121 | 10,103 |
| Last 6 Months | 4.93% | 5.15% | 3.87% | 10,245 | 10,255 | 10,192 |
| Last 1 Year | 5.19% | 5.39% | 4.62% | 10,519 | 10,539 | 10,462 |
| Last 3 Years | 6.03% | 6.27% | 6.51% | 11,921 | 12,003 | 12,085 |
| Last 5 Years | 5.38% | 5.59% | 5.63% | 12,996 | 13,129 | 13,154 |
| Since Inception | 4.93% | 5.11% | 5.57% | 13,687 | 13,842 | 14,241 |
Past performance may or may not be sustained in future and is not a guarantee of any future returns, and should not be used as a basis of comparison with other investments. In case, the start / end date of the concerned period is a non-business date (NBD), the NAV of the previous date is considered for computation of returns. Different Plans i.e. Regular Plan and Direct Plan under the scheme have different expense structure. Benchmark: CRISIL Liquid Overnight Index Additional Benchmark: CRISIL 1 Year T-Bill Index. Fund Manager: Mr. Laukik Bagwe from (Managing since 01-Feb-25). Returns less than 1 year period are simple annualized and greater than 1 year are compounded annualized. Inception date of the scheme (25-Oct-19) Face Value per unit: Rs. 1000. ITI Overnight Fund NAV as on April 30, 2026: Rs. 1359.7005 (Regular Growth Option), Rs. 1368.6896 (Direct Growth Option)
Value of Investment of 10,000 |
||||||
| Period | Fund Returns (%) |
Benchmark Returns (%) |
Additional Benchmark Returns (%) |
Fund () |
Benchmark () |
Additional Benchmark () |
Regular - Growth |
||||||
| Last 7 days | 1.92% | 3.57% | -0.12% | 10,004 | 10,007 | 10,000 |
| Last 15 days | 2.99% | 4.49% | 1.79% | 10,012 | 10,018 | 10,007 |
| Last 1 Month | 7.76% | 8.11% | 3.90% | 10,064 | 10,067 | 10,032 |
| Last 3 Months | 6.21% | 7.10% | 4.25% | 10,153 | 10,175 | 10,105 |
| Last 6 Months | 5.41% | 6.23% | 3.87% | 10,268 | 10,309 | 10,192 |
| Last 1 Year | 5.65% | 6.37% | 4.62% | 10,565 | 10,637 | 10,462 |
| Last 3 Years | 6.27% | 7.19% | 6.51% | 12,006 | 12,323 | 12,089 |
| Since Inception | 5.29% | 6.32% | 5.64% | 12,931 | 13,574 | 13,149 |
Direct - Growth |
||||||
| Last 7 days | 2.63% | 3.57% | -0.12% | 10,005 | 10,007 | 10,000 |
| Last 15 days | 3.70% | 4.49% | 1.79% | 10,015 | 10,018 | 10,007 |
| Last 1 Month | 8.47% | 8.11% | 3.90% | 10,070 | 10,067 | 10,032 |
| Last 3 Months | 6.98% | 7.10% | 4.25% | 10,172 | 10,175 | 10,105 |
| Last 6 Months | 6.21% | 6.23% | 3.87% | 10,308 | 10,309 | 10,192 |
| Last 1 Year | 6.43% | 6.37% | 4.62% | 10,643 | 10,637 | 10,462 |
| Last 3 Years | 7.12% | 7.19% | 6.51% | 12,298 | 12,323 | 12,089 |
| Since Inception | 6.15% | 6.32% | 5.64% | 13,471 | 13,574 | 13,149 |
Past performance may or may not be sustained in future and is not a guarantee of any future returns, and should not be used as a basis of comparison with other investments. The performance data for 5 years period has not been provided, since scheme is in existence for less than 5 years. In case, the start / end date of the concerned period is a non-business date (NBD), the NAV of the previous date is considered for computation of returns. Different Plans i.e. Regular Plan and Direct Plan under the scheme have different expense structure. Benchmark: CRISIL Ultra Short Duration Debt A-I Index Additional Benchmark: CRISIL 1 Year T-Bill Index. Fund Manager: Mr. Laukik Bagwe (Since 01-Feb-25) Inception date of the scheme (05-May-2021). Face Value per unit: Rs. 1000.
ITI Ultra Short Duration Fund NAV as on April 30, 2026: Rs. 1293.1231 (Regular Growth Option), Rs. 1347.0938 (Direct Growth Option)
Value of Investment of 10,000 |
||||||
| Period | Fund Returns (%) |
Benchmark Returns (%) |
Additional Benchmark Returns (%) |
Fund () |
Benchmark () |
Additional Benchmark () |
Regular - Growth |
||||||
| Last 7 days | 3.80% | 4.30% | -0.12% | 10,007 | 10,008 | 10,000 |
| Last 15 days | 4.36% | 4.71% | 1.79% | 10,018 | 10,019 | 10,007 |
| Last 1 Month | 7.71% | 7.32% | 3.90% | 10,063 | 10,060 | 10,032 |
| Last 3 Months | 6.48% | 6.55% | 4.24% | 10,158 | 10,160 | 10,103 |
| Last 6 Months | 5.98% | 6.11% | 3.87% | 10,297 | 10,303 | 10,192 |
| Last 1 Year | 6.05% | 6.10% | 4.62% | 10,605 | 10,610 | 10,462 |
| Last 3 Years | 6.61% | 6.86% | 6.51% | 12,121 | 12,205 | 12,085 |
| Last 5 Years | 5.73% | 6.04% | 5.63% | 13,213 | 13,412 | 13,154 |
| Since Inception | 5.20% | 5.68% | 5.74% | 14,274 | 14,738 | 14,801 |
Direct - Growth |
||||||
| Last 7 days | 3.87% | 4.30% | -0.12% | 10,007 | 10,008 | 10,000 |
| Last 15 days | 4.44% | 4.71% | 1.79% | 10,018 | 10,019 | 10,007 |
| Last 1 Month | 7.79% | 7.32% | 3.90% | 10,064 | 10,060 | 10,032 |
| Last 3 Months | 6.61% | 6.55% | 4.24% | 10,161 | 10,160 | 10,103 |
| Last 6 Months | 6.13% | 6.11% | 3.87% | 10,304 | 10,303 | 10,192 |
| Last 1 Year | 6.21% | 6.10% | 4.62% | 10,621 | 10,610 | 10,462 |
| Last 3 Years | 6.78% | 6.86% | 6.51% | 12,178 | 12,205 | 12,085 |
| Last 5 Years | 5.89% | 6.04% | 5.63% | 13,313 | 13,412 | 13,154 |
| Since Inception | 5.34% | 5.68% | 5.74% | 14,414 | 14,738 | 14,801 |
Past performance may or may not be sustained in future and is not a guarantee of any future returns, and should not be used as a basis of comparison with other investments. the start / end date of the concerned period is a non-business date (NBD), the NAV of the previous date is considered for computation of returns. Different Plans i.e. Regular Plan and Direct Plan under the scheme have different expense structure. Benchmark: CRISIL Liquid Debt A-I Index Additional Benchmark: CRISIL 1 Year T-Bill Index. Fund Manager: Mr. Laukik Bagwe from (Managing since 01-Feb-25). Returns less than 1 year period are simple annualized and greater than 1 year are compounded annualized. Inception date of the scheme (24-Apr-19). Face Value per unit: Rs. 1000. ITI Liquid Fund NAV as on April 30, 2026: Rs. 1427.3739 (Regular Growth Option), Rs. 1441.3563 (Direct Growth Option)
Value of Investment of 10,000 |
||||||
| Period | Fund Returns (%) |
Benchmark Returns (%) |
Additional Benchmark Returns (%) |
Fund () |
Benchmark () |
Additional Benchmark () |
Regular - Growth |
||||||
| Last 1 Year | 5.92% | 7.00% | 4.62% | 10,592 | 10,700 | 10,462 |
| Last 3 Years | 6.83% | 7.58% | 6.51% | 12,198 | 12,457 | 12,089 |
| Last 5 Years | 5.22% | 6.42% | 5.63% | 12,901 | 13,654 | 13,154 |
| Since Inception | 4.73% | 5.64% | 5.62% | 13,598 | 14,397 | 14,384 |
Direct - Growth |
||||||
| Last 1 Year | 6.68% | 7.00% | 4.62% | 10,668 | 10,700 | 10,462 |
| Last 3 Years | 7.61% | 7.58% | 6.51% | 12,467 | 12,457 | 12,089 |
| Last 5 Years | 6.01% | 6.42% | 5.63% | 13,388 | 13,654 | 13,154 |
| Since Inception | 5.52% | 5.64% | 5.62% | 14,286 | 14,397 | 14,384 |
Past performance may or may not be sustained in future and is not a guarantee of any future returns, and should not be used as a basis of comparison with other investments. In case, the start / end date of the concerned period is a non-business date (NBD), the NAV of the previous date is considered for computation of returns. Different Plans i.e. Regular Plan and Direct Plan under the scheme have different expense structure. Benchmark: Nifty 50 Arbitrage Index Additional Benchmark: CRISIL 1 Year T-Bill Index. Fund Managers: Mr Vikas Nathani (Managing Since 01-Jan-24) and Mr. Laukik Bagwe (Managing Since 01-Feb-25). Inception date of the scheme (09-Sep-19). Face Value per unit: Rs. 10. ITI Arbitrage Fund Fund NAV as on April 30, 2026: Rs. 13.5980 (Regular Growth Option), Rs. 14.2858 (Direct Growth Option)
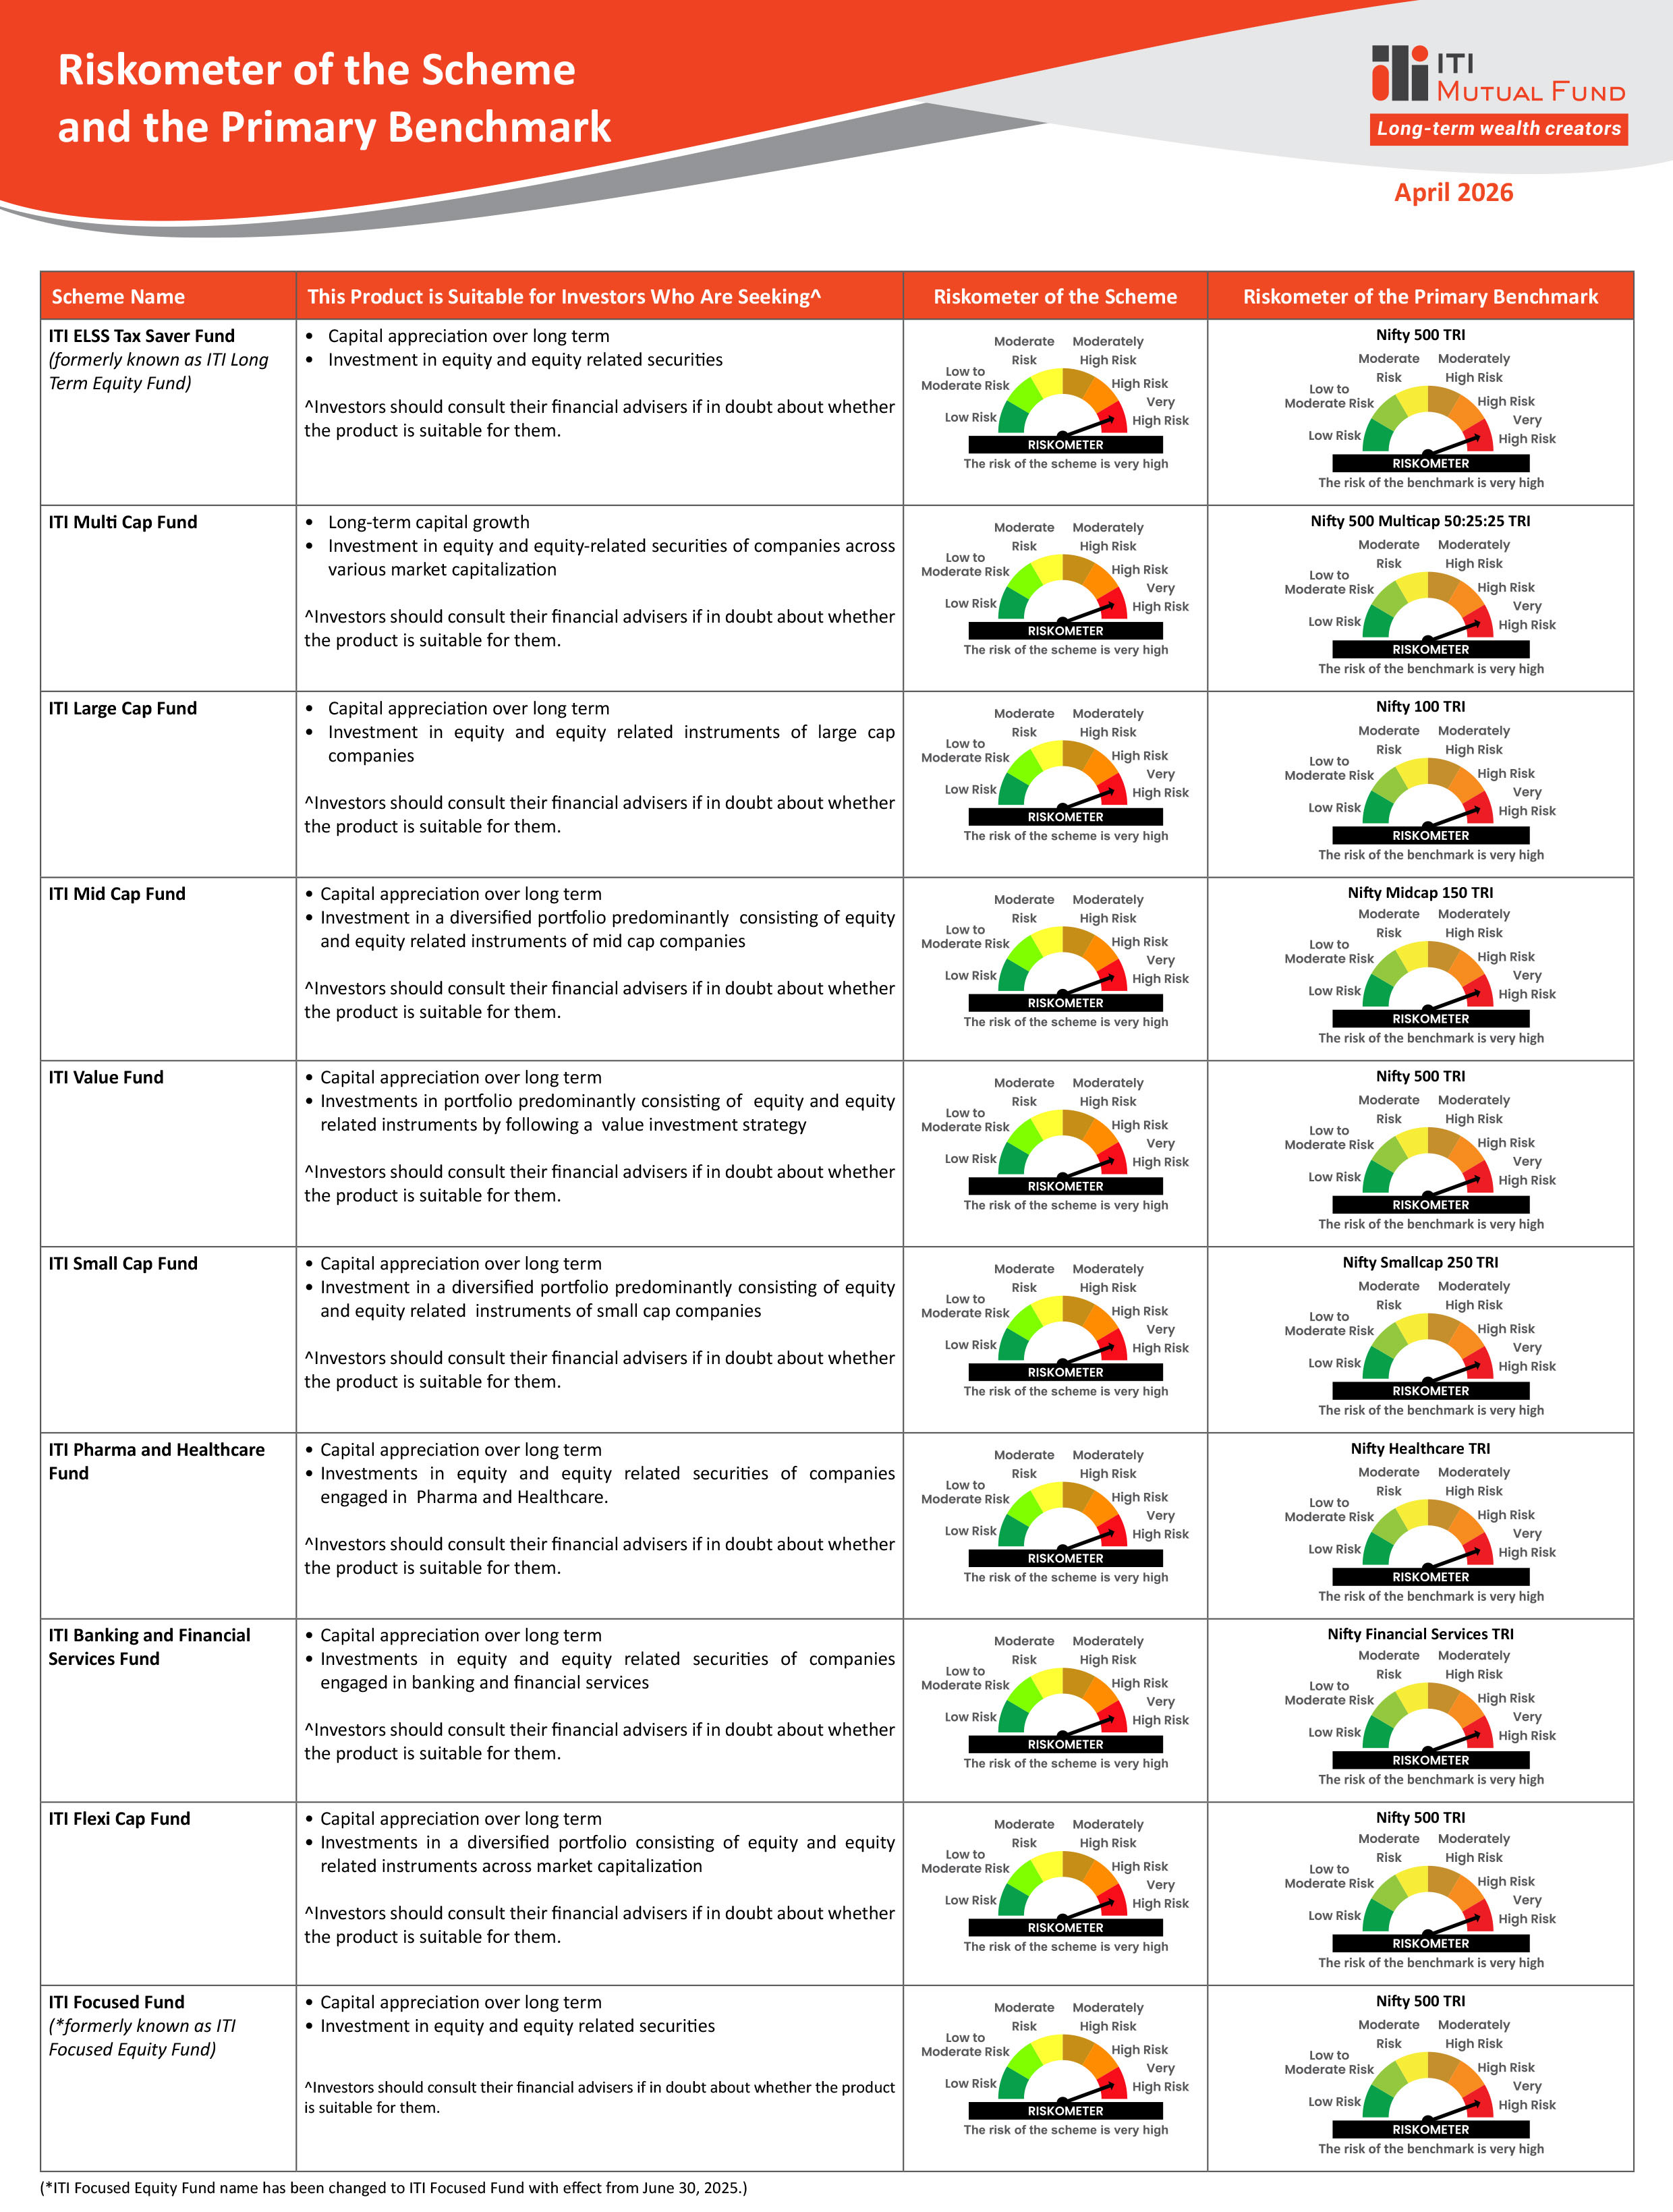
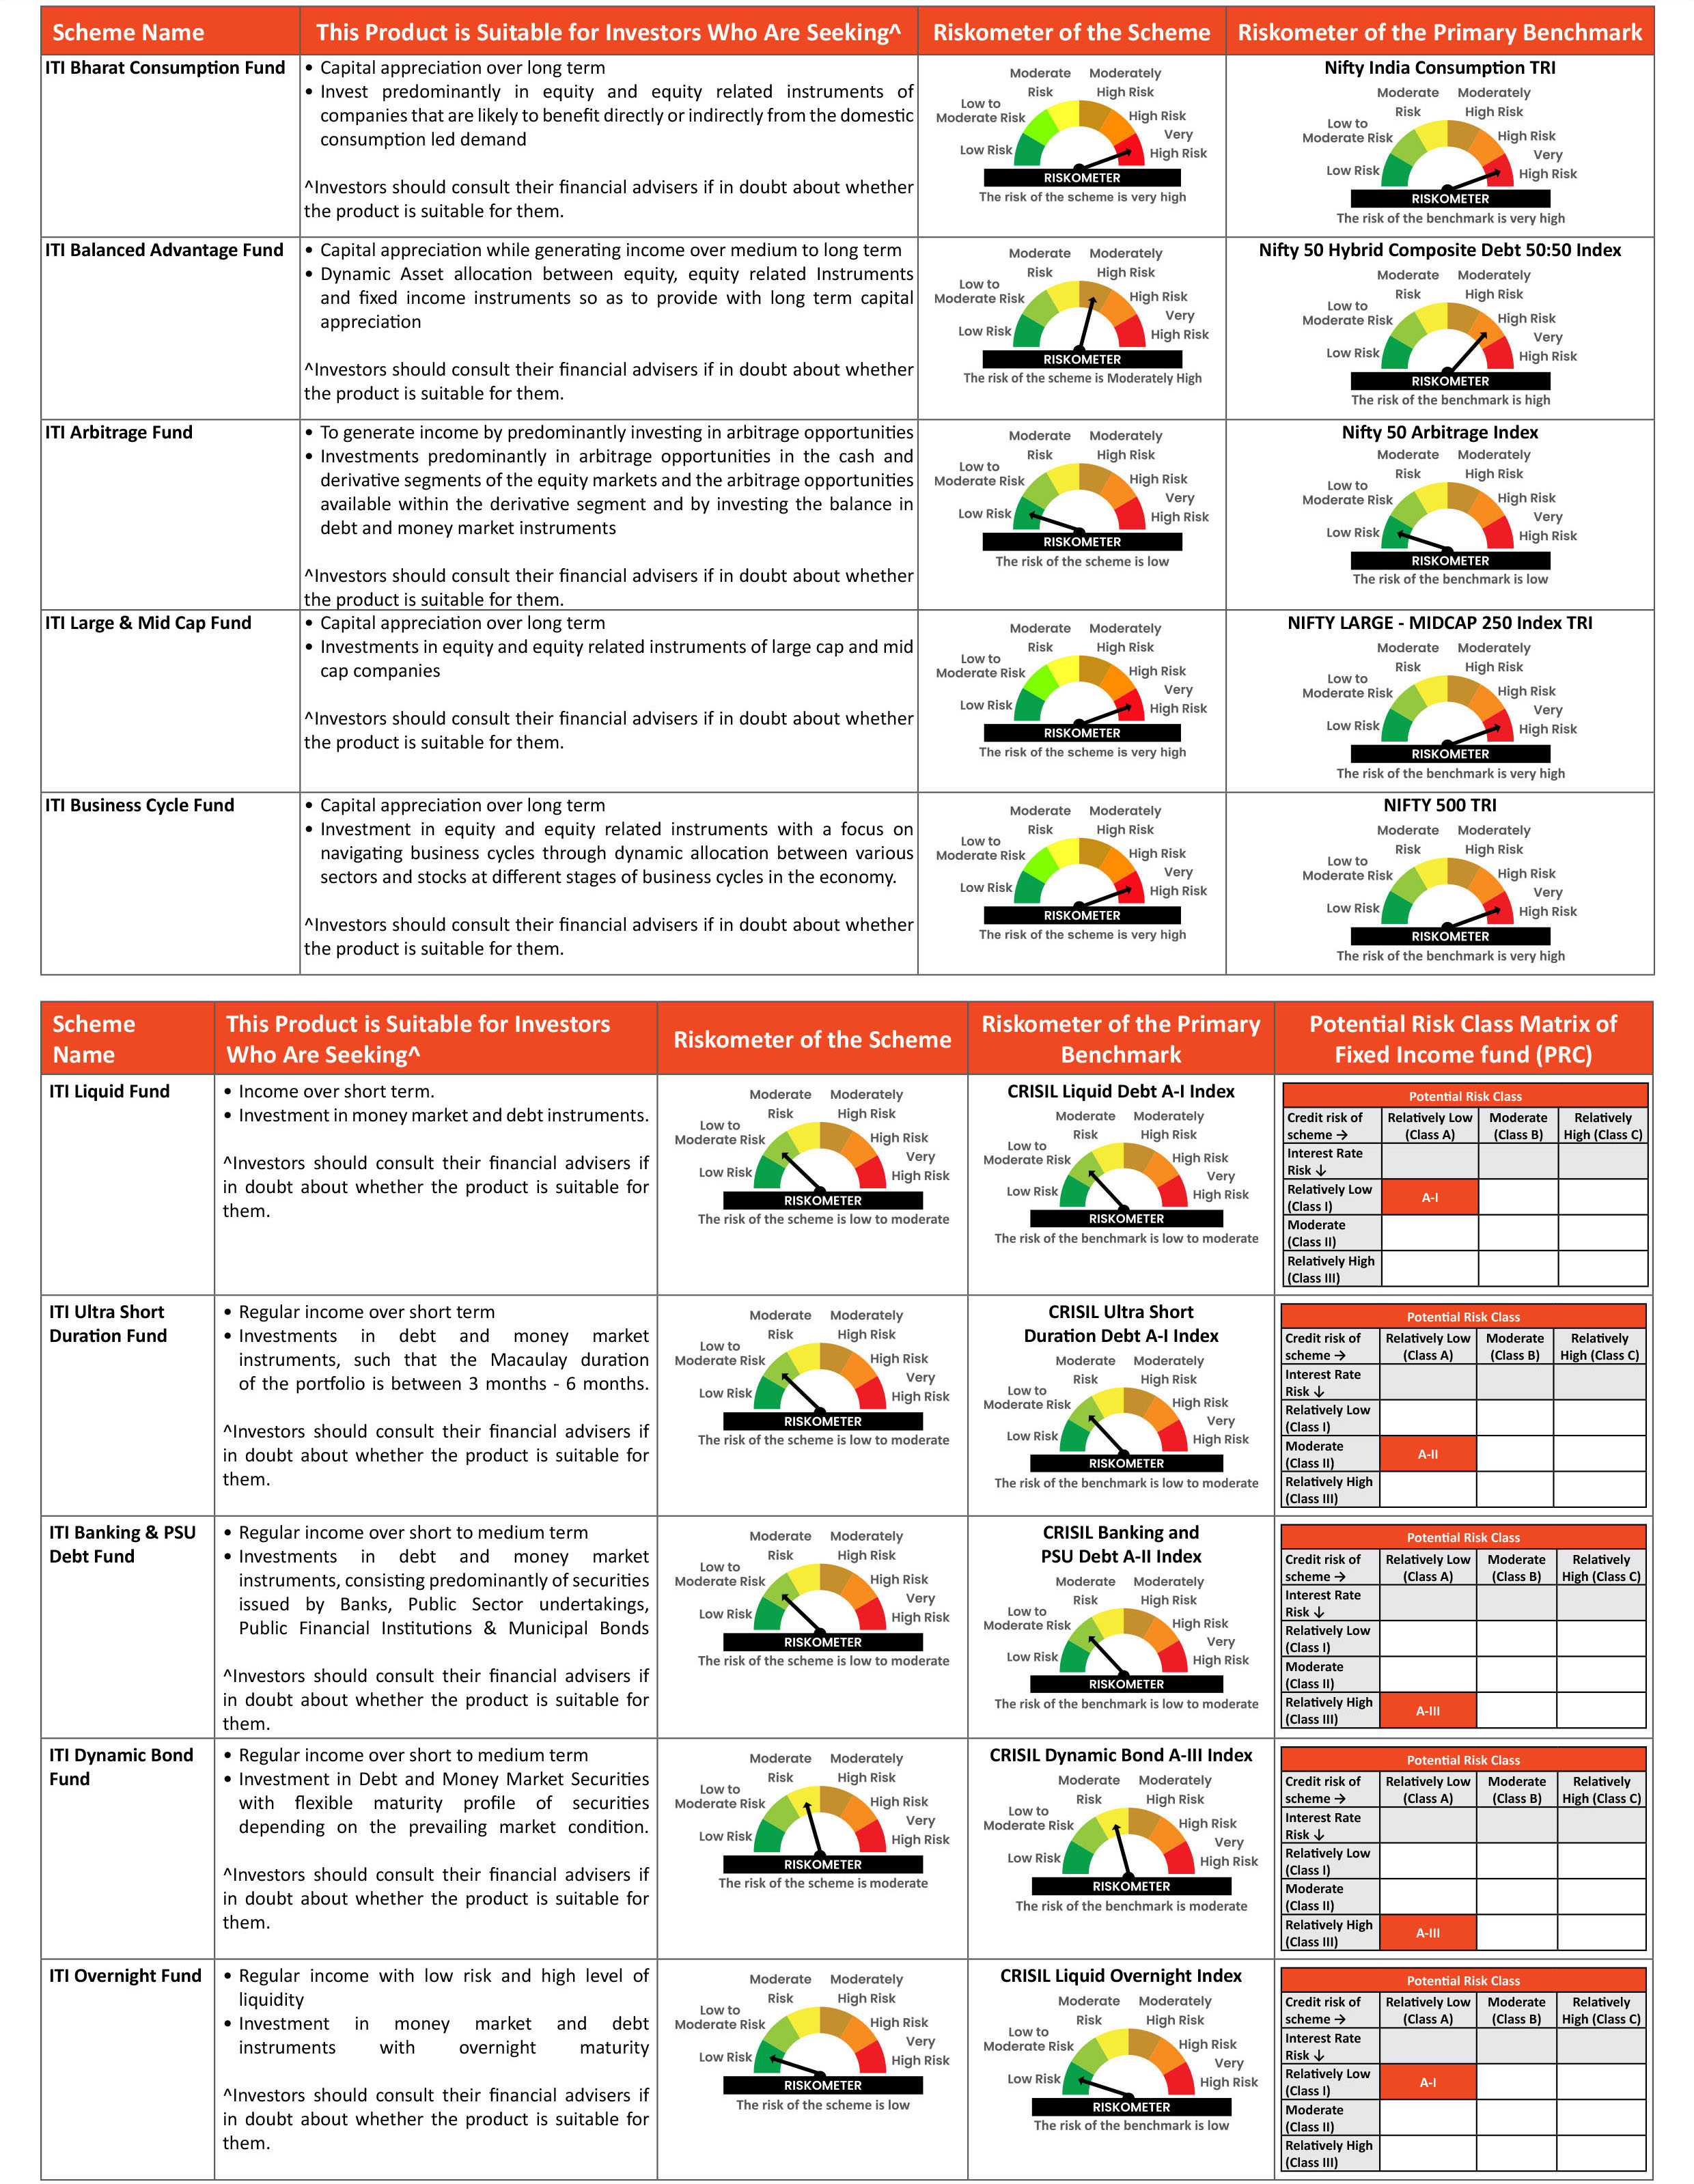
Disclaimer - Fund Performance
The performance details provided herein are of Growth option under Direct and Regular Plans. Assuming Rs. 10,000 invested as lumpsum 1 year ago as well as since inception. The returns for the respective periods
are provided as on last available NAV of 30th April 2026. Returns 1 year and above are Compounded Annualised, below 1 year returns for are Simple Annualised. Load is not taken into consideration for computation of
performance. Different plans shall have a different expense structure. The expenses of the Direct Plan under the Scheme will be lower to the extent of the distribution expenses / commission charged to the Other than Direct
Plan. The performance data of the scheme(s) managed by the respective Fund manager which has/have not completed 6 months is not provided. *Mr. Rajesh Bhatia is the Fund Manager for overseas investments (Since 08th
June 2024) of ITI Business Cycle Fund, ITI Multi Cap Fund, ITI Large Cap Fund, ITI Mid Cap Fund, ITI Small Cap Fund, ITI Pharma and Healthcare Fund, ITI Banking and Financial Services Fund, ITI Value Fund, ITI Balanced
Advantage Fund, ITI Flexi Cap Fund & ITI Focused Fund. There is no overseas investment at this point of time.